MAT 114 – MATHEMATICAL REASONING
advertisement

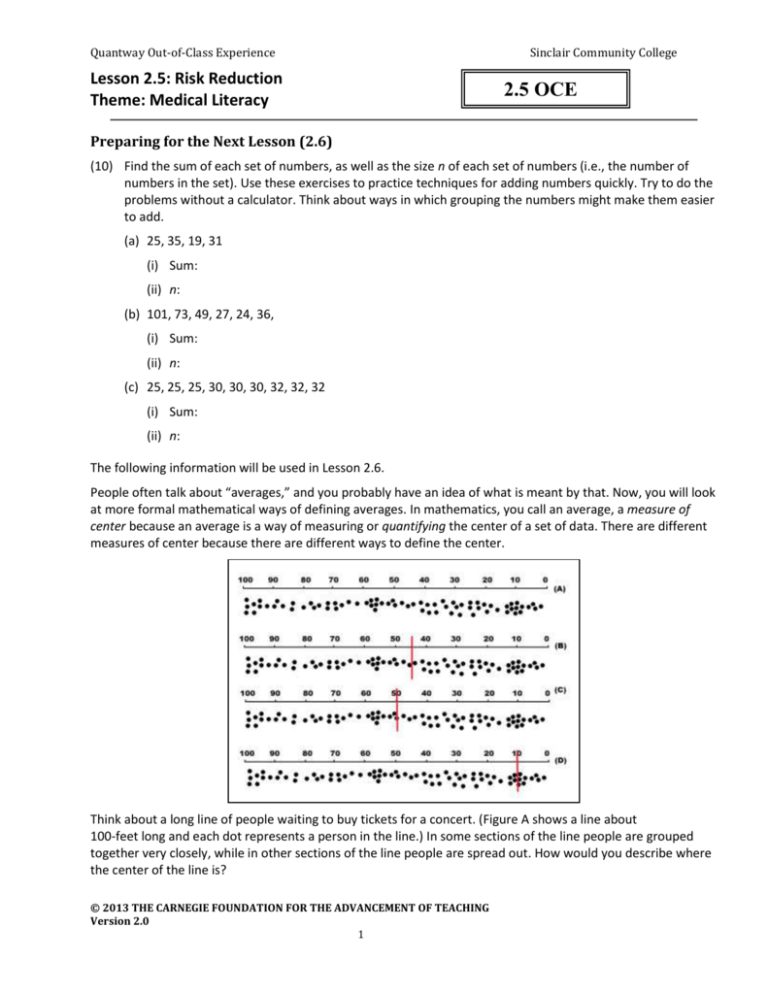
Quantway Out-of-Class Experience Lesson 2.5: Risk Reduction Theme: Medical Literacy Sinclair Community College 2.5 OCE Preparing for the Next Lesson (2.6) (10) Find the sum of each set of numbers, as well as the size n of each set of numbers (i.e., the number of numbers in the set). Use these exercises to practice techniques for adding numbers quickly. Try to do the problems without a calculator. Think about ways in which grouping the numbers might make them easier to add. (a) 25, 35, 19, 31 (i) Sum: (ii) n: (b) 101, 73, 49, 27, 24, 36, (i) Sum: (ii) n: (c) 25, 25, 25, 30, 30, 30, 32, 32, 32 (i) Sum: (ii) n: The following information will be used in Lesson 2.6. People often talk about “averages,” and you probably have an idea of what is meant by that. Now, you will look at more formal mathematical ways of defining averages. In mathematics, you call an average, a measure of center because an average is a way of measuring or quantifying the center of a set of data. There are different measures of center because there are different ways to define the center. Think about a long line of people waiting to buy tickets for a concert. (Figure A shows a line about 100-feet long and each dot represents a person in the line.) In some sections of the line people are grouped together very closely, while in other sections of the line people are spread out. How would you describe where the center of the line is? © 2013 THE CARNEGIE FOUNDATION FOR THE ADVANCEMENT OF TEACHING Version 2.0 1 Quantway Out-of-Class Experience Lesson 2.5: Risk Reduction Theme: Medical Literacy Sinclair Community College 2.5 OCE Would you define the center of the line by finding the point at which half the people in the line are on one side and half are on the other (see Figure B)? Is the center based on the length of the line even though there would be more people on one side of the center than on the other (see Figure C)? Would you place the center among the largest groups of people (see Figure D)? The answer would depend on what you needed the center for. When working with data, you need different measures for different purposes. Mean (Arithmetic Average) Find the average of numeric values by finding the sum of the values and dividing the sum by the number of values. The mean is what most people call the “average.” Example Find the mean of 18, 23, 45, 18, 36 Find the sum of the numbers: 18 + 23 + 45 + 18 +36 = 140 Divide the sum by 5 because there are 5 numbers: 140 ÷ 5 = 28 The mean is 28. Median Find the median of numeric values by arranging the data in order of size. If there is an odd number of values, the median is the middle number. If there is an even number of values, the median is the mean of the two middle numbers. Example (data set with odd number of values) Find the median of 18, 23, 45, 18, 36. Write the numbers in order: 18, 18, 23, 36, 45 There is an odd number of values, so the median is the number in the middle. The median is 23. Example (data set with even number of values) Find the median of 18, 23, 45, 18, 12, 50. Write the numbers in order: 12, 18, 18, 23, 45, 50 There is an even number of values, so there is no one middle number. Find the median by finding the mean of the two middle numbers: 18 + 23 = 41 41 ÷ 2 = 20.5 The median is 20.5. Mode Find the mode by finding the number(s) that occur(s) most frequently. There may be more than one mode. Example Find the mode of 18, 23, 45, 18, 36. The number 18 occurs twice, more than any other number, so the mode is 18. © 2013 THE CARNEGIE FOUNDATION FOR THE ADVANCEMENT OF TEACHING Version 2.0 2 Quantway Out-of-Class Experience Lesson 2.5: Risk Reduction Theme: Medical Literacy Sinclair Community College 2.5 OCE (11) Write the answers to the following questions on a piece of paper and bring it to the next class period. If you do not own a credit card, answer Part (a) only. Keep your responses anonymous by writing only the answers to the questions. (Do not write your name.) (a) How many credit cards do you possess? (b) Do you normally pay the entire balance on the credit card statement? (c) What is the approximate balance (total) on your card(s) right now? (12) You will be expected to do the following things for the next class. Rate how confident you are on a scale of 1–5 (1 = not confident and 5 = very confident). Before beginning Lesson 2.6, you should understand the concepts and demonstrate the skills listed below: Skill or Concept: I can … Rating from 1 to 5 Perform basic operations using quantities such as integers, fractions, or decimals with the aid of technology. Identify the mean, median, and mode of a small data set. (13) In the question above, if you or another student had any ratings below 3, what are some things that you or the student could do to increase your/their confidence while planning for Lesson 2.6? Please describe at least two ways. © 2013 THE CARNEGIE FOUNDATION FOR THE ADVANCEMENT OF TEACHING Version 2.0 3 Quantway Student Handout Lesson 2.6: What Is Average? Theme: Personal Finance Sinclair Community College 2.6 LESSON Specific Objectives Students will understand that numerical data can be summarized using measures of central tendency. how each statistic—mean, median, and mode—provide a different snapshot of the data. that conclusions derived from statistical summaries are subject to error. that a spreadsheet can be used to organize data. Students will be able to calculate the mean, median, and mode for numerical data. create a data set that meets certain criteria for measures of central tendency. Problem Situation: Summarizing Data About Credit Cards A revolving line of credit is an agreement between a consumer and lender that allows the consumer to obtain credit for an undetermined amount of time. The debt is repaid periodically and can be borrowed again once it is repaid. The use of a credit card is an example of a revolving line of credit. According to www.CreditCards.com, U.S. consumers own more than 600 million credit cards. About 98% of the total U.S. revolving debt is made up of credit card debt. Average credit card debt per household with a credit card is $14,743. Worldwide, there are more than $2.5 trillion in transactions annually. It is estimated that there are 10,000 card payment transactions made every second. According to the U.S. government (2009), 15% of college freshmen had a zero balance on their credit card. The median debt carried by freshmen was $939. Seniors graduated with an average credit card debt of more than $4,100, and one-fifth of seniors owed more than $7,000 on their credit cards. In 2004, three-fourths of all American families had at least one credit card, but only 58% carried a balance. If a credit card user carries a balance (e.g., does not pay the monthly debt in full) the credit card company assesses a finance charge (interest) for the use of their money. This can be avoided by paying the balance in full.1 In the first part of this lesson, you will use the information about credit cards given above to learn about some ways to summarize quantitative information. (1) The population of the United States is slightly more than 300 million people. There are about 100 million households in the United States. What is the average number of credit cards per person? What is the average number of credit cards per household? 1Retrieved from www.creditcards.com/credit-card-news/credit-card-industry-facts-personal-debt-statistics-1276.php © 2013 THE CARNEGIE FOUNDATION FOR THE ADVANCEMENT OF TEACHING Version 2.0 4 Quantway Student Handout Sinclair Community College Lesson 2.6: What Is Average? Theme: Personal Finance 2.6 LESSON (2) Consider the statement, “Average credit card debt per household with a credit card is $14,743.” What does this mean? (3) The introduction states that “college seniors graduated with an average credit card debt of more than $4,100.” Imagine you ask four groups of five college graduates what their credit card debt is. The amount of debt for each senior in each group is shown in the table. Group A Group B Group C Group D $ 0 $ 4,100 $ 5,800 $ 20,500 $ 11,200 $ 4,100 $ 4,000 $ 0 $ 500 $ 4,100 $ 3,500 $ 0 $ 4,600 $ 4,100 $ 5,000 $ 0 $ 4,200 $ 4,100 $ 2,200 $ 0 (a) Find the average debt of each group of college graduates. Make sure the value you found is reasonable given the values in the table. (b) Complete the data set called “Your Data” so that it represents the debt of five college seniors with a average debt of $4,100. Your Data © 2013 THE CARNEGIE FOUNDATION FOR THE ADVANCEMENT OF TEACHING Version 2.0 5 Quantway Student Handout Sinclair Community College Lesson 2.6: What Is Average? Theme: Personal Finance 2.6 LESSON (c) Find the median of each set of data including the one you created. Group A Group B Group C Group D Your Data (4) The introductory information gives data about the median debt carried by freshmen. Create a data set of six freshmen so that the data set has the same median reported for all college freshmen. Debt of College Freshmen Note on language: The word average is used in mathematics. There are actually several different kinds of averages. The one that you have discussed in this course is the arithmetic mean. You will also see people use the word average when referring to the mean. You should be familiar with both terms. Making Connections Record the important mathematical ideas from the discussion. Further Applications (1) This course draws on examples from three themes: Citizenship, Personal Finance, and Medical Literacy. Choose at least two different lessons with the Personal Finance theme. Answer the following questions. (a) What new information did you learn about personal finance? (b) How will you use this information or why is it important to know this information? © 2013 THE CARNEGIE FOUNDATION FOR THE ADVANCEMENT OF TEACHING Version 2.0 6 Quantway Student Handout Sinclair Community College Lesson 2.6: What Is Average? Theme: Personal Finance 2.6 LESSON Advantages and Disadvantages of the Measures of Central Tendency MEAN Advantages: Disadvantage: Most commonly used measure of central Greatly influenced by large and small tendency. numbers in the set Easily calculated with the availability of calculators and computers MEDIAN Advantages: Disadvantage: ***Not usually influence by large and Not generally used for advanced small numbers in the set statistics Always a true indicator of the “center” of the set of data Calculations are simple since one only has to put the set in number order MODE Advantages: Disadvantage: ***The only measure of central tendency Not necessarily unique (there may be for non-numeric data more than one mode) The easiest measure of central tendency to May not exist find Need not be at the center of the data © 2013 THE CARNEGIE FOUNDATION FOR THE ADVANCEMENT OF TEACHING Version 2.0 7 Quantway Student Handout Lesson 2.6: What Is Average? Theme: Personal Finance Sinclair Community College 2.6 LESSON Which statistic (mean, median, or mode) is most appropriate in each of the following situations? (a) Tables in the dining hall are numbered 1 through 12 for students who eat there. The principal calls out a number for the table that will go through the buffet line first. The other tables follow in order of the table numbers. One student is sure the principal calls certain tables more often. She keeps track of which numbers are called over a 21-day period. (i) Mean (ii) Median (iii) Mode (b) The offensive line of a football team is larger than in previous years. The program will list a statistic to show this fact. (i) Mean (ii) Median (iii) Mode (c) A reporter is doing a story on the falling prices of homes in a large neighborhood. The reporter wants to demonstrate how the prices have fallen for most homes even though there were a few very expensive houses sold. (i) Mean (ii) Median (iii) Mode © 2013 THE CARNEGIE FOUNDATION FOR THE ADVANCEMENT OF TEACHING Version 2.0 8 Quantway Out-of-Class Experience Sinclair Community College Lesson 2.6: What Is Average? Theme: Personal Finance 2.6 OCE Making Connections to the Lesson (1) Which of the following was one of the main mathematical ideas of the lesson? (i) Any of the three measures of central tendency (mean, median, and mode) are good representations of data. It does not matter which one you use. (ii) U.S. college students carry far too much credit card debt. (iii) The mean is calculated by adding all the numbers and dividing by the number of data points. (iv) The mean, median, and mode all give important information about a data set, but they do not give a complete picture of the data set. (2) In Lesson 2.4, you learned about reading graphs. Describe a connection between interpreting a graph and interpreting measures of central tendency. You can use one of the sentence stems given below if you wish. Question number______ in Lesson 2.4 connects to Question number ______ in Lesson 2.6 because… The idea of _________________ in Lesson 2.4 connects to Lesson 2.6. An example of the connections is… Developing Skills and Understanding (3) Use the following data set to answer the questions. 13 15 20 20 20 20 20 20 20 23 27 31 (a) What is the mean? (b) What is the mode? (c) What is the median? (d) What fraction of the numbers in the data set are less than the median? (e) What fraction of the numbers in the data set are greater than the median? (f) Which of the following statements are correct? (i) The median is the middle of a data set. Half of the data points are always less than the median, and half are always greater than the median. (ii) The median is the middle of a data set. Half of the data points are either less than or equal to the median. (iii) The median is the middle of a data set. At least half of the data points are always equal to the median. (iv) The median is not the middle of a data set. You cannot predict the distribution of the numbers in relationship to the median. © 2013 THE CARNEGIE FOUNDATION FOR THE ADVANCEMENT OF TEACHING Version 2.0 9 Quantway Out-of-Class Experience Lesson 2.6: What Is Average? Theme: Personal Finance Sinclair Community College 2.6 OCE (4) Consider the statement “Worldwide, there are more than $2.5 trillion in credit card transactions annually.” (a) What is the daily average dollar amount of transactions? Round to the nearest hundred million dollars. (b) How many dollars in credit card transactions are made each day? (i) $6,849,315 (ii) $6,849,315,068 (iii) $1,460,000,000 (iv) $1,460,000 (v) It is impossible to know. (5) Students at Dover Community College (DCC) have a mean credit card debt of $3,600 with a median of $1,500. Students at Ralton Community College (RCC) have a mean credit card debt of $3,000 with a median of $2,800. Which statements about the two groups are true based on this information? There may be more than one correct answer. (i) Less than half of DCC students have debt in excess of $3,600. (ii) No more than half of RCC students have debt less than $2,800. (iii) About three-fourths of DCC students have debt less than $3,600. (iv) The largest debt of the RCC students is less than the largest debt of the DCC students. (v) The total debt of RCC students is less than the total debt of DCC students. (vi) The total debt of RCC students is larger than the total debt of DCC students. (6) Decide whether the following statements must be true or not, based on the information provided. If the statement must be true, write True; otherwise, write False. Be prepared to explain your reasoning. (a) The median of 25 numbers is 13. Twelve of the numbers must be greater than 13. (b) The average of 11 numbers is 130. None of the 11 numbers are more than 260. (c) The average of 25 numbers is 100, and the median of those 25 numbers is also 100. The mode of the 25 numbers must be 100. (d) The mean of 45 numbers is 70. If you pick any group of 10 numbers from the 45, the mean will be 70. (e) The average of 42 numbers is 20. The sum of all 42 numbers is 840. (f) The average of 49 numbers is 100. If a 50th number is added and the average remains at 100, the 50th number must have been 100. © 2013 THE CARNEGIE FOUNDATION FOR THE ADVANCEMENT OF TEACHING Version 2.0 10 Quantway Out-of-Class Experience Sinclair Community College Lesson 2.6: What Is Average? Theme: Personal Finance 2.6 OCE (7) Rio Blanca City Hall publishes the following statistics on household incomes of the town’s citizens. The mode is given as a range. Mean: $257,000 Median: $65,000 Mode: $20,000–$30,000 Which measure would be the most useful for each of the following situations? (a) State officials want to estimate the total amount of state income tax paid by the citizens of Rio Blanca. (b) The school district wants to know the income level of the largest number of students. (c) A businesswoman is thinking about opening an expensive restaurant in the town. She wants to know how many people in town could afford to eat at her restaurant. Making Connections Across the Course (8) Use Figures 1 and 2 for the following questions. (a) Shade 40% of each figure. Figure 1 © 2013 THE CARNEGIE FOUNDATION FOR THE ADVANCEMENT OF TEACHING Version 2.0 11 Figure 2 Quantway Out-of-Class Experience Lesson 2.6: What Is Average? Theme: Personal Finance Sinclair Community College 2.6 OCE (b) Which of the following statements are correct? There may be more than one correct answer. (i) The shaded area of Figure 1 is larger than the shaded area of Figure 2 because Figure 1 is larger than Figure 2. (ii) The shaded area of Figure 1 is the same size as the shaded area of Figure 2 because they are both 40% of the square. (iii) The shaded area of Figure 1 is equal to the shaded area of Figure 2 because they are both 40% of the square. (c) These figures illustrate what important concept? (i) Percentages cannot be used for comparisons unless the reference values are equal. (ii) Percentages compare measures relative to the size of the reference values, but do not give information about absolute measures. (iii) Percentages are a ratio out of 100, so they can always be compared directly. In other words, 60% of one value is equal to 60% of another value. (9) Animal population densities are important to those who manage wildlife. This is particularly true when animals pose risks to humans. Managing the population of grizzly bears in Yellowstone National Park is one example. Grizzly bears roam Yellowstone Park, which is 3,472 square miles. Additionally, the bears roam a surrounding area that is 40% as large as Yellowstone. Each male grizzly bear needs a territory to roam that is about 300 square miles, while each female bear needs a roaming territory of about 100 square miles. Although their territories overlap considerably, each bear needs at least 10 square miles to himself/herself to call home.2 For the following questions, assume that bears roam freely within and outside Yellowstone without being captured or shot. (a) Calculate the total available land in and around Yellowstone for grizzly bears to roam. Round to the nearest square mile. (b) Estimate the maximum number of bears that can be supported on the available land. (c) If there are about 1.5 adult female bears for every adult male bear, then approximately how many male bears can live in and around Yellowstone Park? How many female bears? The bar graph below shows the number of bear sightings (all bears, not only grizzlies) in Yellowstone National Park from 1998 to 2002.3 Because the number of sightings is affected by the number of visitors to the park, these data are shown as well.4 2 Retrieved from www.nrmsc.usgs.gov/files/norock/products/IGBST/2009report. Retrieved from www.nps.gov/yell/naturescience/bearsighttable.htm. 4 Retrieved from www.nature.nps.gov/stats/park.cfm?parkid=421. 3 © 2013 THE CARNEGIE FOUNDATION FOR THE ADVANCEMENT OF TEACHING Version 2.0 12 Quantway Out-of-Class Experience Lesson 2.6: What Is Average? Theme: Personal Finance Sinclair Community College 2.6 OCE Note: Because the number of visitors each year is much larger than the number of bear sightings, the data are plotted on different scales. The scale on the left (ranging from 0 to 3,500,000) is for the number of visitors, shown in gray. The scale on the right (ranging from 0 to 980) is for the number of bear sightings, shown in black. (d) In what year was the percentage of visitors who saw bears the highest? (e) In what two years was the percentage of visitors who saw bears the lowest? (f) Estimate the average number of bear sightings over these five years. (i) 600 (ii) 700 (iii) 800 (iv) 900 © 2013 THE CARNEGIE FOUNDATION FOR THE ADVANCEMENT OF TEACHING Version 2.0 13


