HW2Sol
CSSS 508: Intro to R
1/20/06
Homework 2 Solutions
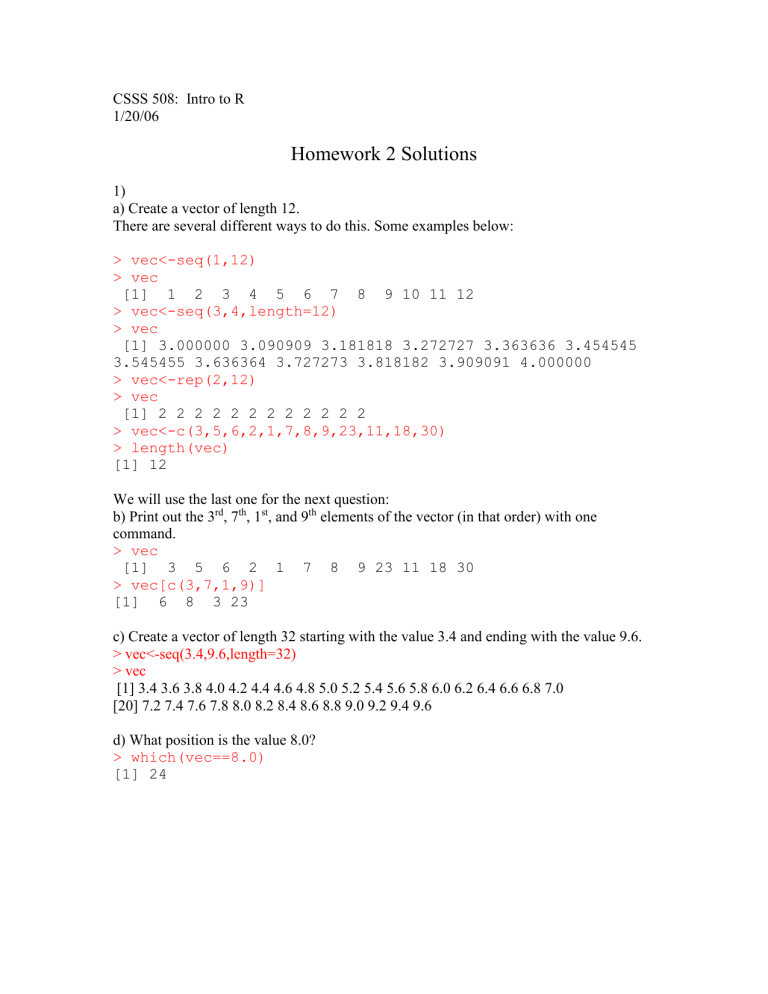
1) a) Create a vector of length 12.
There are several different ways to do this. Some examples below:
> vec<-seq(1,12)
> vec
[1] 1 2 3 4 5 6 7 8 9 10 11 12
> vec<-seq(3,4,length=12)
> vec
[1] 3.000000 3.090909 3.181818 3.272727 3.363636 3.454545
3.545455 3.636364 3.727273 3.818182 3.909091 4.000000
> vec<-rep(2,12)
> vec
[1] 2 2 2 2 2 2 2 2 2 2 2 2
> vec<-c(3,5,6,2,1,7,8,9,23,11,18,30)
> length(vec)
[1] 12
We will use the last one for the next question: b) Print out the 3 rd , 7 th , 1 st , and 9 th elements of the vector (in that order) with one command.
> vec
[1] 3 5 6 2 1 7 8 9 23 11 18 30
> vec[c(3,7,1,9)]
[1] 6 8 3 23 c) Create a vector of length 32 starting with the value 3.4 and ending with the value 9.6.
> vec<-seq(3.4,9.6,length=32)
> vec
[1] 3.4 3.6 3.8 4.0 4.2 4.4 4.6 4.8 5.0 5.2 5.4 5.6 5.8 6.0 6.2 6.4 6.6 6.8 7.0
[20] 7.2 7.4 7.6 7.8 8.0 8.2 8.4 8.6 8.8 9.0 9.2 9.4 9.6 d) What position is the value 8.0?
> which(vec==8.0)
[1] 24
e) Create the following vector without the use of the c() command:
1 1 1 1 2 2 2 2 3 3 3 3 4 4 4 4 5 5 5 5
> sort(rep(seq(1,5),4))
[1] 1 1 1 1 2 2 2 2 3 3 3 3 4 4 4 4 5 5 5 5
The seq(1,5) creates the sequence: 1 2 3 4 5. rep(seq(1,5),4) creates four of them:
1 2 3 4 5 1 2 3 4 5 1 2 3 4 5 1 2 3 4 5 sort(rep(seq(1,5),4)) puts them in the right order.
2) Create the following 4 by 4 matrix.
> m2<-matrix(c(1,6,3,2,3,2,7,1,4,12,8,8,2,9,9,0),4,4)
> m2
[,1] [,2] [,3] [,4]
[1,] 1 3 4 2
[2,] 6 2 12 9
[3,] 3 7 8 9
[4,] 2 1 8 0 a) Return the 2 nd
> m2[,2]
column.
[1] 3 2 7 1 b) Return the element in the 3 rd
row, 4 th
> m2[3,4]
column.
[1] 9 c) Change the element in the 2 nd row, 2 nd column to a 3.
> m2[2,2]<-3
> m2
[,1] [,2] [,3] [,4]
[1,] 1 3 4 2
[2,] 6 3 12 9
[3,] 3 7 8 9
[4,] 2 1 8 0 d) Return the elements on the diagonal.
> diag(m2)
[1] 1 3 8 0
3) help(rnorm). rnorm is a function that simulates data from a normal
(Gaussian) distribution with a chosen mean and a standard deviation. a) Create a random sample from a normal distribution of length 200 with mean 4 and standard deviation 2
> x<-rnorm(200,4,2) b) How many are less than 2?
> sum(x<2)
[1] 37 c) How many are between 3 and 5?
> sum(x>3&x<5)
[1] 68 d) Calculate the mean and standard deviation of your sample.
> mean(x)
[1] 3.911475
> sd(x)
[1] 2.058732
4) Download the hw2example.dat from the class website. a) Read this table into R.
> data<-read.table("//IntroR/HW2/hw2example.dat") b) What are its dimensions?
> dim(data)
[1] 230 5
230 rows, 5 columns c) Find the mean, standard deviation, minimum, and maximum of the fourth column.
> mean(data[,4])
[1] NA (must have some missing data in the column)
> mean(data[,4],na.rm=TRUE)
[1] 4.92087
> sd(data[,4],na.rm=TRUE)
[1] 1.028961
> min(data[,4],na.rm=TRUE)
[1] 2.091993
> max(data[,4],na.rm=TRUE)
[1] 7.929153
d) With one command, return the 1 st
, 3 rd
, and 23 rd
rows.
> data[c(1,3,23),]
X1 X2 X3 X4 X5
1 3.331534 1.004398 3 5.894764 0
3 4.173725 1.706009 3 5.639135 1
23 3.778880 1.068323 4 3.100711 1 e) With one command, return the 2 nd
and 4 th
columns for rows 112 and 113.
> data[112:113,c(2,4)]
X2 X4
112 1.983643 4.383827
113 1.839409 5.391009 f) Where are the missing values in the data?
We can approach this by looking at one column at a time.
(looking at each row would take longer)
> which(is.na(data[,1])) numeric(0)
> which(is.na(data[,2]))
[1] 98
> which(is.na(data[,3]))
[1] 4 215
> which(is.na(data[,4]))
[1] 126
> which(is.na(data[,5]))
[1] 12
There are no missing values in column 1, one in column 2, two in column 3, one in column 4, and one in column 5.
[98,2], [4,3], [215,3], [126,4], [12,5]
