Mathematical and Computational Methods for Engineers
advertisement
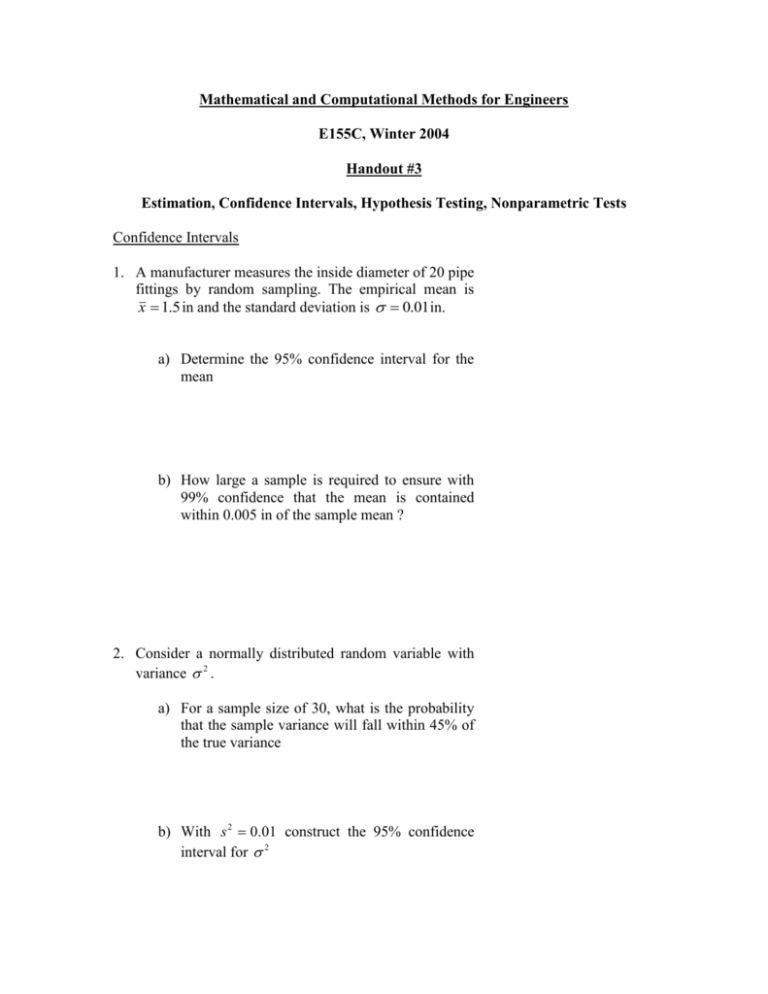
Mathematical and Computational Methods for Engineers E155C, Winter 2004 Handout #3 Estimation, Confidence Intervals, Hypothesis Testing, Nonparametric Tests Confidence Intervals 1. A manufacturer measures the inside diameter of 20 pipe fittings by random sampling. The empirical mean is x 1.5 in and the standard deviation is 0.01 in. a) Determine the 95% confidence interval for the mean b) How large a sample is required to ensure with 99% confidence that the mean is contained within 0.005 in of the sample mean ? 2. Consider a normally distributed random variable with variance 2 . a) For a sample size of 30, what is the probability that the sample variance will fall within 45% of the true variance b) With s 2 0.01 construct the 95% confidence interval for 2 3. Six samples of hardened concrete have been tested for compressive strength. The following values were recorded: 4052 4120 4095 4188 3978 4090 The strength is believed to be normally distributed. a) Determine the 90% confidence interval for the mean b) If was assumed to be known such that 69.96 , find the 90% confidence interval for the mean Estimation 4. Suppose X is known to be normally distributed with known variance 2 . Find the maximum likelihood estimator for the mean. 5. Suppose X is normally distributed with known mean but unknown variance. Find the maximum likelihood estimate for the variance. Hypothesis Testing 6. A structural engineer is experimenting with a new alloy that may increase the yield of a high-strength structural steel. The objective is to demonstrate that the new alloy is superior to the old one. From experience it is known that for this class of alloys the yield strength is normally distributed with the standard deviation 0.75 ksi and the mean strength of 46 ksi. The plan is to take 9 rods of the new alloy and demonstrate that the mean yield is larger than 46 ksi at the 5% significance level. Assume that x 46.9 ksi. 7. In designing a service system, it is beneficial to have a hypothesis regarding the number of units to be serviced in a given time frame. Too low an estimate will result in inadequate service, and too high an estimate will result in a waste of resources. Suppose that company’s allocation has been based on 110 users. It is desired to check if there has been a relevant deviation at the significance level of 5%. Assume that 8.4 users and n 25 . 8. The environmental agency of a certain city claims that the amount of hydrocarbons in the atmosphere has been reduced to a level of 1.8 ppm. To verify the claim, a sample of 12 observations is to be taken. It is known that the measurements tend to be normally distributed. Suppose that the sample mean is x 1.68 ppm with standard deviation of s 0.17 ppm. Test the hypothesis at 1% significance level. 9. A manufacturer suspects that substandard parts have been substituted for the ones ordered. From experience, it is known that only 10% of parts are generally defective. Suppose that 60 parts are chosen randomly from the shipment and 9 were found to be defective. Test the null hypothesis at the 5% significance level. 10. In milling, surfaces are machined by a rotating cutter. Suppose a cylinder head is to be cut to a high degree of precision. After a period of use it is desired to check the variation occurring in a particular machine. The machine must receive maintenance when 2 exceeds 9 10 6 in2. A sample of 30 yields s 2 1.4 105 in2. Due to costly service and down time, assume 0.01. At this level of significance, should the maintenance be performed ? 11. A claim is made that the service life of brake pads produced by manufacturer A is over 4,000 mi longer than the life of pads produced by manufacturer B. 40 randomly chosen samples were selected from each of the two brands. Test the claim at a 5% significance level. x 42,500 y 36,400 x 4,400 y 5,300 Nonparametric Tests 12. A chemist wishes to demonstrate that the melting point of a new compound exceeds 184.5 degrees C. The underlying distribution of the temperature measurements is not known. Twelve measurements are taken and the results are shown below. Test the hypothesis at the 10% confidence level. 185, 186, 185, 182, 183, 186, 186, 185, 183, 184, 185, 187 13. Suppose that eight operators were tested, first in rooms without A/C and then in rooms with A/C over the same period of time. The number of errors made was recorded. w/o A/C w A/C 5 5 2 4 3 5 3 5 1 3 3 3 0 2 4 4 Test the hypothesis that the median has not changed. 14. The temperature is measured during a given time period in 3 consecutive years at a specified location: 85 90 87 Determine whether or not there has been a positive trend at the 5% confidence level.


