College Algebra Lecture Notes, Section 3.1
advertisement
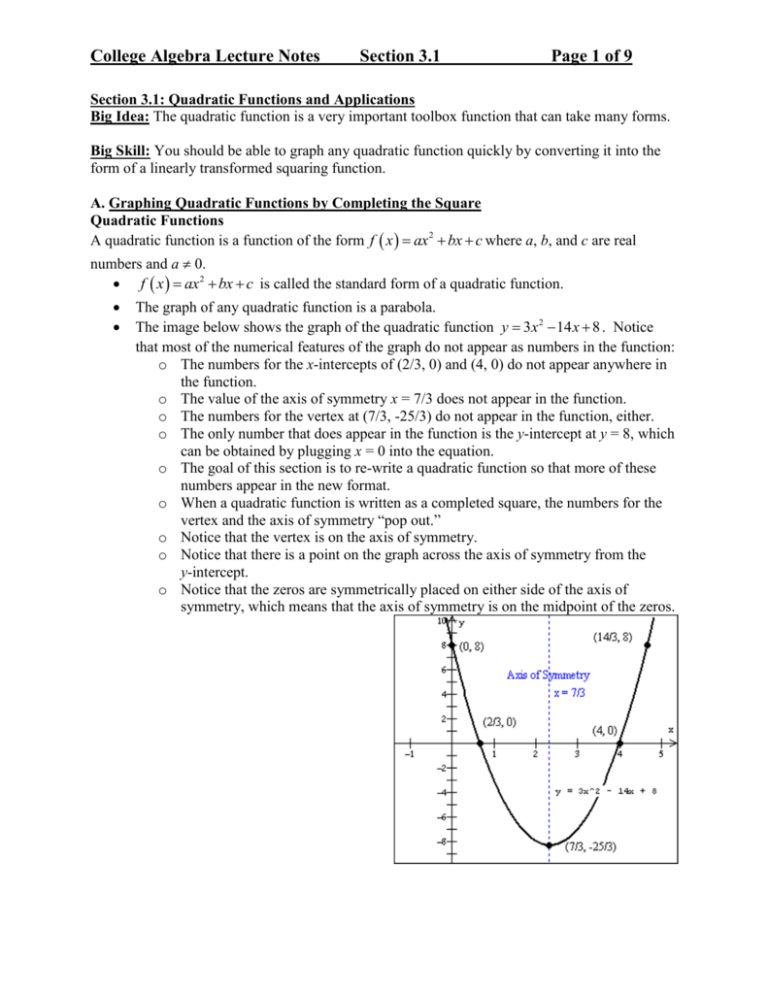
College Algebra Lecture Notes Section 3.1 Page 1 of 9 Section 3.1: Quadratic Functions and Applications Big Idea: The quadratic function is a very important toolbox function that can take many forms. Big Skill: You should be able to graph any quadratic function quickly by converting it into the form of a linearly transformed squaring function. A. Graphing Quadratic Functions by Completing the Square Quadratic Functions A quadratic function is a function of the form f x ax2 bx c where a, b, and c are real numbers and a 0. f x ax2 bx c is called the standard form of a quadratic function. The graph of any quadratic function is a parabola. The image below shows the graph of the quadratic function y 3x 2 14 x 8 . Notice that most of the numerical features of the graph do not appear as numbers in the function: o The numbers for the x-intercepts of (2/3, 0) and (4, 0) do not appear anywhere in the function. o The value of the axis of symmetry x = 7/3 does not appear in the function. o The numbers for the vertex at (7/3, -25/3) do not appear in the function, either. o The only number that does appear in the function is the y-intercept at y = 8, which can be obtained by plugging x = 0 into the equation. o The goal of this section is to re-write a quadratic function so that more of these numbers appear in the new format. o When a quadratic function is written as a completed square, the numbers for the vertex and the axis of symmetry “pop out.” o Notice that the vertex is on the axis of symmetry. o Notice that there is a point on the graph across the axis of symmetry from the y-intercept. o Notice that the zeros are symmetrically placed on either side of the axis of symmetry, which means that the axis of symmetry is on the midpoint of the zeros. College Algebra Lecture Notes Section 3.1 Page 2 of 9 Graphing y f x ax2 bx c by Completing the Square Group the variable terms apart from the constant c. f x ax 2 bx c f x ax 2 bx c Factor out the leading coefficient a. f x ax 2 bx c b f x a x2 x c a Identify the coefficient of the linear term; multiply it by ½ and square the result. 2 b2 1 b 4a 2 2 a Add that result to the grouped terms, then subtract a b2 from the constant term to 4a 2 maintain an equivalent expression. b f x a x2 x c a 2 b b2 b2 f x a x x 2 c a 2 a 4a 4a Write the resulting perfect square trinomial as the square of the binomial and simplify. 2 b b2 b2 f x a x x 2 c a 4a 4a 2 b 4ac b 2 f x a x 2a 4a 4a b 4ac b 2 f x a x 2a 4a Graph using transformations of f x x2 . 2 2 b b 2 4ac f x a x 4a 2a f x a x h 2 k b . 2a o The graph is stretched / reflected about the x-axis by a factor a. b 2 4ac o The graph is shifted down by . 4a o The graph is shifted right by College Algebra Lecture Notes Section 3.1 Page 3 of 9 Practice: 1. Graph the quadratic function f x 3x2 7 x 1.5 by completing the square. 2. Graph the quadratic function f x x2 4 x 7 by completing the square. College Algebra Lecture Notes Section 3.1 Page 4 of 9 B. Graphing Quadratic Functions Using the Vertex Formula Notice that after completing the square, formula for the coordinates of the vertex “pop out” when compared to the form of a linearly transformed squaring function: 2 b 4ac b 2 f x a x 2a 4a 2 b b 2 4ac f x a x 4a 2a f x a x h + k Vertex Formula For the quadratic function f x ax2 bx c , the coordinates of the vertex are: 2 b b2 4ac , 4a 2a Note that b 2 4ac is the discriminant of the quadratic formula for the solution of the quadratic equation ax 2 bx c 0 . Note that by plugging the x-coordinate of the vertex into the function (i.e., since y = f(x) ), the vertex formula can also be written as b b h, k , f 2a 2a h, k College Algebra Lecture Notes Section 3.1 Page 5 of 9 The x-Intercepts of the Graph of Parabola The x-intercepts of a graph are the x values where y = 0: y0 f x 0 ax 2 bx c 0 Thus, the x-intercepts of the graph of a parabola are given by the quadratic formula. We can anticipate the number of x-intercepts based on the discriminant: If the discriminant D b 2 4ac 0 , then the graph of f x ax2 bx c has two different xb D . 2a f x 2 x 2 5x 1 intercepts at x D b 2 4ac D 52 4 2 1 D 33 x b D 2a 5 33 0.186 5 33 4 x 4 5 33 2.686 4 If the discriminant D b 2 4ac 0 , then the graph of f x ax2 bx c has one x-intercept, and the vertex of the graph will touch the x-axis at x f x 1.7 x2 6.8x 6.8 D b 2 4ac D 6.82 4 1.7 6.8 D0 b D 2a 6.8 0 x 2 1.7 x x2 b . 2a College Algebra Lecture Notes Section 3.1 Page 6 of 9 If the discriminant D b 2 4ac 0 , then the graph of f x ax2 bx c has no x-intercepts (the graph does not cross or touch the x-axis). f x 0.6x2 2.1x 3.6 D b 2 4ac D 2.12 4 0.6 3.6 D 4.23 x b D 2a 2.1 4.23i 2.1 4.23 1.2 x 1.2 2.1 4.23i 1.2 Practice: 3. Graph the quadratic function f x 2 x2 12 x 18 using the vertex formula. College Algebra Lecture Notes Section 3.1 Page 7 of 9 4. Graph the quadratic function f x x 2 2 x 2 using the vertex formula. 5. Graph the quadratic function y x 2 2 x 3 using the vertex formula. College Algebra Lecture Notes Section 3.1 Page 8 of 9 C. Finding the Equation of a Quadratic Function from Its Graph If you can read off the zeros at x = x1 and x = x2 and, then the function is f x x x1 x x2 . If you can read off the vertex at (h, k) and the coordinates of a second point, then the 2 function is f x a x h k , where you compute a by plugging in values from the second point. Practice: 6. Find the equation of the function graphed below. 7. Find the equation of the function graphed below. College Algebra Lecture Notes Section 3.1 Page 9 of 9 D. Quadratic Functions and Extreme Values Notice that the x-coordinate of the vertex is always the midpoint of the zeros of the quadratic function. The vertex is also the extreme (maximum or minimum) of the function. Practice: 8. A company’s daily revenue R as a function of the price of its product p is given by: 1 R p p 2 300 p . Find the price that maximizes the daily revenue and the 2 maximum revenue. 9. A farmer has 2000 feet of fencing to enclose a rectangular field. Find the maximum area that can be fenced off and the dimensions of that maximum size field.

