SUMMARY OF YEAR ONE, NEW TECH HIGH SCHOOLS, as of
advertisement
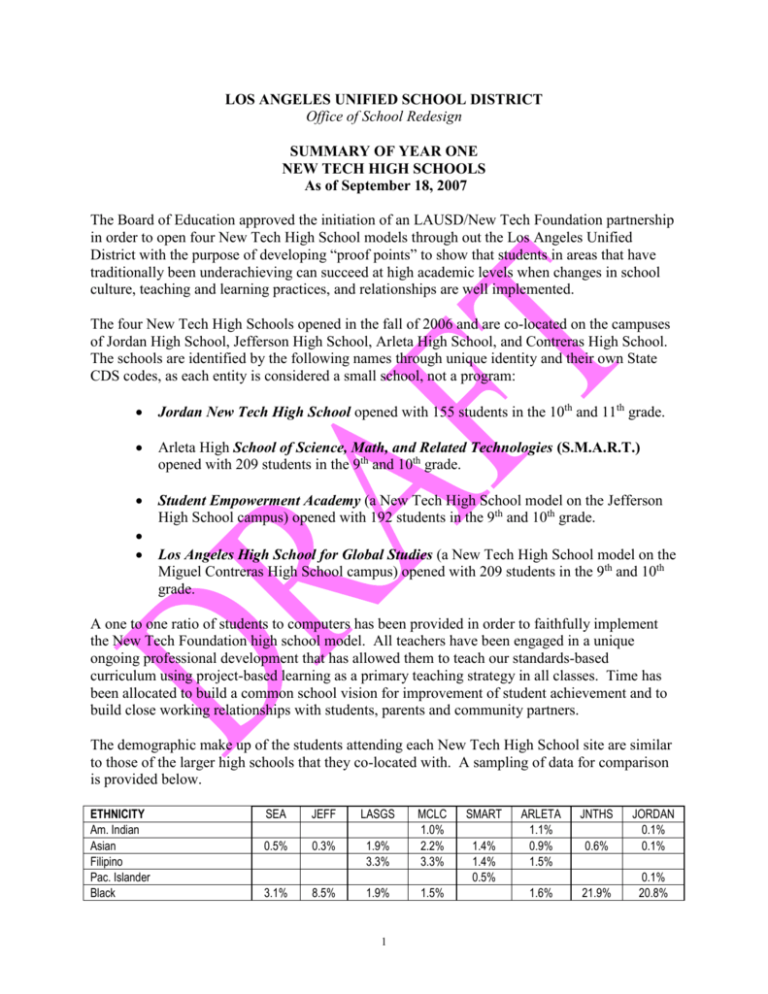
LOS ANGELES UNIFIED SCHOOL DISTRICT Office of School Redesign SUMMARY OF YEAR ONE NEW TECH HIGH SCHOOLS As of September 18, 2007 The Board of Education approved the initiation of an LAUSD/New Tech Foundation partnership in order to open four New Tech High School models through out the Los Angeles Unified District with the purpose of developing “proof points” to show that students in areas that have traditionally been underachieving can succeed at high academic levels when changes in school culture, teaching and learning practices, and relationships are well implemented. The four New Tech High Schools opened in the fall of 2006 and are co-located on the campuses of Jordan High School, Jefferson High School, Arleta High School, and Contreras High School. The schools are identified by the following names through unique identity and their own State CDS codes, as each entity is considered a small school, not a program: Jordan New Tech High School opened with 155 students in the 10th and 11th grade. Arleta High School of Science, Math, and Related Technologies (S.M.A.R.T.) opened with 209 students in the 9th and 10th grade. Student Empowerment Academy (a New Tech High School model on the Jefferson High School campus) opened with 192 students in the 9th and 10th grade. Los Angeles High School for Global Studies (a New Tech High School model on the Miguel Contreras High School campus) opened with 209 students in the 9th and 10th grade. A one to one ratio of students to computers has been provided in order to faithfully implement the New Tech Foundation high school model. All teachers have been engaged in a unique ongoing professional development that has allowed them to teach our standards-based curriculum using project-based learning as a primary teaching strategy in all classes. Time has been allocated to build a common school vision for improvement of student achievement and to build close working relationships with students, parents and community partners. The demographic make up of the students attending each New Tech High School site are similar to those of the larger high schools that they co-located with. A sampling of data for comparison is provided below. ETHNICITY Am. Indian Asian Filipino Pac. Islander Black SEA JEFF LASGS 0.5% 0.3% 1.9% 3.3% MCLC 1.0% 2.2% 3.3% 3.1% 8.5% 1.9% 1.5% 1 SMART 1.4% 1.4% 0.5% ARLETA 1.1% 0.9% 1.5% JNTHS 0.6% JORDAN 0.1% 0.1% 1.6% 21.9% 0.1% 20.8% Hispanic White 96.4% 91.0% 0.1% 91.9% 1.0% 92.2% 0.6% 95.7% 1.0% 92.9% 2.0% 77.4% 78.9% 0.1% POVERTY INDICATOR Free/Reduced Lunch Eligible SEA 89.6% JEFF 87.6% LASGS 92.3% MCLC 98.9% SMART 81.8% ARLETA 80.3% JNTHS 88.4% JORDAN 79.3% ENGLISH LEARNERS EL Students SEA 38.7% JEFF 49.9% LASGS 36.8% MCLC 49.9% SMART 34.4% ARLETA 34.6% JNTHS 31.2% JORDAN 42.2% SPECIAL EDUCATION Students with Active IEP SEA 3.0% JEFF 13.6% LASGS 9.5% MCLC 7.3% SMART 7.1% ARLETA 10.7% JNTHS 9.6% JORDAN 14.7% A review of the demographic data (provided by the LAUSD Decision Support System) for each school shows that students enrolled in the four New Tech campuses are representative of the total school enrollment on the larger school site. The combined data reveals that: 90% of the students are Hispanic 88% of the students are on free or reduced lunch 35% of the students are English Language Learners 7% of the students have an active Special Education Individualized Education Plan It has been necessary to complete facilities work in order to faithfully implement the New Tech Foundation high school model at each school. The required facilities work differed at each of the four campuses. The Arleta and Contreras campuses opened as new schools and therefore these sites required specific changes in the facilities to address space, data and power needs necessary for classrooms large enough and organized to support team teaching in a technologyrich environment. The Jordan and Jefferson campuses required significantly greater facilities work. These existing campuses were not built to the requirements of space, data, or power adequate for implementation of this model. The facilities’ planning at these two sites was divided into two phases with the final phase to be completed during the winter of 2007. With the completion of the winter facilities work, all four schools will be able to house a maximum of 400 students in grades 9 -12 which will be reached by the Fall 2008 school semester. The New Tech High School model was placed at these four locations as they are representative of the demographics for the total Los Angeles Unified School District community. They are expected to establish “proof points” of academic success that can be used to inform changes in the teaching and learning practices through out the system. In order to measure the success of this educational model, a set of multiple measures has been determined that will be reviewed on a yearly basis by the Office of School Redesign. The multiple measurement indicators include: Academic Performance index (API) Adequate Yearly Progress (AYP) STAR Test Results Attendance Rates Suspension Rates Drop out and Promotion Rates 2 Parent Involvement Graduation Rates CAHSEE Passing Rates This report does not include drop out or promotion rates, graduation rates, or levels of parent involvement. However, we are benchmarking this information as future measurable data. Student attendance rates at the four New Tech High Schools show clear increases in student attendance over the co-located large high schools sharing campus space. Three of the New Tech model high schools had attendance rates of 94.5% or higher. The comparison of data between the New Tech High Schools and the co-located school sites leads us to conclude that small schools lead to improvement in student attendance. STUDENT ATTENDANCE RATE (June 2007) New Tech HS SEA 96.1% LASGS 95.6% SMART 95.4% JNTHS 89.6% Complex HS JEFF MCLC ARLETA JORDAN 93.3% 91.9% 93.4% 85.6% (Source: LAUSD Decision Support System) Percent of students suspended is a fair early indicator of school culture change that may be occurring at the New Tech sites. In two of the four sites, significant reductions in the suspension rate are apparent. The third site shows some reduction in the suspension rate, and the fourth site is continuing to work toward improvement of this accountability measure. STUDENT SUSPENSION RATE (June 2007) New Tech HS SEA 2.3% LASGS 13.0% SMART 10.0% JNTHS 11.4% Complex HS JEFF MCLC ARLETA JORDAN 25.1% 8.9% 9.3% 18.1% (Source: LAUSD Decision Support System) CAHSEE First Year Test Data provides our first instructional data for review. In all but one case, we see that the New Tech sites had tenth grade first time testers pass both portions of the CAHSEE at a rate equal to or higher than the LAUSD rate of 51%. The New Tech sites in all but one outperformed the larger school significantly. CAHSEE FIRST TIME (ELA & MATH) PASS RATES, March 2007 Administration New Tech HS SEA 63% JEFF LASGS 58% MCLC SMART 51% ARLETA JNTHS 38% JORDAN Complex HS 23% 43% 44% 38% (Source: LAUSD Planning, Assessment and Research) A review of the 2007 California Standardized Test Report shows that three of the four New Tech schools outperformed the co-located schools in English Language Arts. 3 2007 CALIFORNIA STANDARDIZED TESTING AND REPORTING (STAR) Students scoring proficient and above in English- Language Arts 9th Grade 10th Grade New Tech HS Complex HS New Tech HS Complex HS SEA 21% JEFF 9% SEA 18% JEFF 6% LASGS 24% MCLC 18% LASGS 22% MCLC 18% SMART 30% ARLETA 28% SMART 30% ARLETA 14% JNTHS JORDAN 18% JNTHS 9% JORDAN 11% (Source: LAUSD Decision Support System) 2007 GROWTH ACEDEMIC PERFORMANCE INDEX (API) New Tech HS SEA 636 LASGS 613 SMART 623 JNTHS 501 Complex HS JEFF MCLC ARLETA JORDAN 457 561 578 526 (Source: California Department of Education) SUMMARY A summary of the early available data using the large co-located high school as a control group provides us with the following analysis: New Tech High School students in geographically different parts of the city are attending school at a higher rate than those students on the general campus. The attendance rate difference ranges from 1.6% to 9.7%. The overall suspension rates when comparing the New Tech High Schools to the general high schools is 9% for the New Techs, and 15% for the general high schools. The first time CAHSEE data for tenth grade students shows that three of the four New Tech sites significantly outperformed the comparable student group on the large general campus. Three of the New Tech sites scored at or above the LAUSD average passing rate on the first time CAHSEE assessment. In the two New Tech high schools that have been identified as closest to fully implementing the model, they have significantly outperformed expectations for their first year of implementation. The New Tech model was implemented to develop “proof points” for the improvement of student achievement in areas of the district where significant numbers of students are underperforming. The following outcomes at this early stage of development are worth stating: The New Tech High Schools provide us with models of project-based learning as a valuable instructional tool for students of all demographic groups. The New Tech High Schools are showing the value and importance of a shared community vision that provides direction and goals for improving student achievement. The New Tech Foundation has determined that two of our four New Tech High Schools are national models for their foundation. As a result of the successes at both the Student Empowerment Academy (New Tech, Jefferson) and the Los Angeles School for Global Studies (New Tech, Contreras), the New Tech Foundation has 4 chosen these two sites as part of their national study tours for school districts considering replication of the New Tech High School model. The New Tech model of assessment through projects and exhibitions, along with effective use of rubrics provides students real world experiences that create greater relevance to the standards-based content. The New Tech model gives teachers the opportunity to collaborate and interact in a professional manner through team-teaching in a cross-curricular setting. The professional school environment highlighting the importance of 21st Century skills as found in the New Tech model leads to increased sense of trust and responsibility between all members of the community. It further prepares students to be college prepared and career ready for life after their high school graduation. There is value in working closely with outside partners such as the New Tech Foundation and their local representative organization, UNITELA as they provide both instructional and operational support for these schools. We are seeing value added opportunities when school leaders and teaching staff become part of a network where sharing of practices and ideas to improve teaching and learning can occur. We still have a lot to do and a lot to learn from the faithful replication of this model including: Strong and collaborative leadership and planning between the school leadership of both schools is necessary. Issues that we have thought to be unique to large schools must be addressed in small schools, as well. For example, discipline policies are important at any school and they must be fully understood and fairly implemented with consistency to improve the school culture. Without a strong vision that is supported by a strong instructional plan and a strong plan for personalization, no school reform model will be effectively implemented. Faithful replication of a successful model does not occur without hard work, frequent conversations that include all stakeholders, and a sense of urgency to change the school culture to meet the needs of every student. 5


