Template in MS-Word format - People Server at UNCW
advertisement

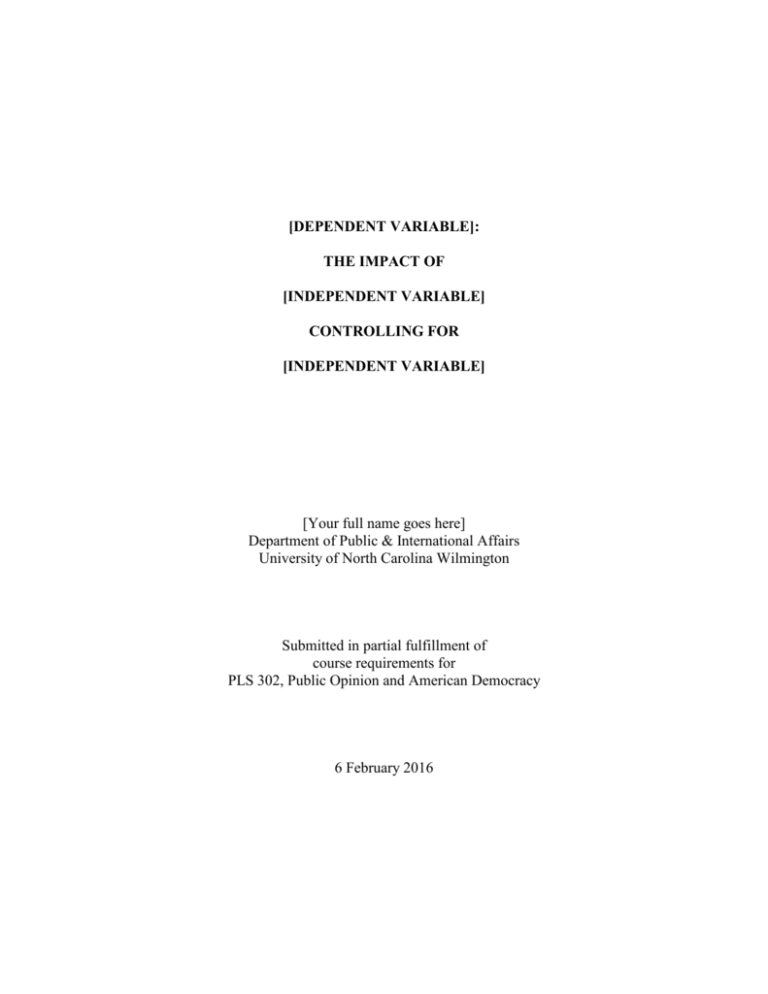
[DEPENDENT VARIABLE]: THE IMPACT OF [INDEPENDENT VARIABLE] CONTROLLING FOR [INDEPENDENT VARIABLE] [Your full name goes here] Department of Public & International Affairs University of North Carolina Wilmington Submitted in partial fulfillment of course requirements for PLS 302, Public Opinion and American Democracy 6 February 2016 INTRODUCTION Statement of the Problem Start your paper with a one-paragraph introduction to the phenomenon examined and its substantive significance. A good format here is to start the paragraph with a broad perspective on how the problem you address fits into the larger scheme of human affairs before narrowing your focus at the end of the paragraph to a specific statement of the problem. Literature Review and Hypotheses Univariate hypothesis. Compose a one- or two-paragraph summary of plausible arguments for and against your univariate hypothesis. Include summaries of any published research relevant to this hypothesis. H1: State a univariate hypothesis predicting the distribution of values on your dependent variable. Bivariate hypothesis. Give a one- or two-paragraph summary of plausible arguments for and against your bivariate hypothesis. Include summaries of any published research relevant to this hypothesis. H2: State a bivariate hypothesis that predicts the relationship [direct or inverse] between the dependent and independent variable. Multivariate hypothesis. Write a one- or two-paragraph summary of plausible arguments for and against your multivariate hypothesis. Include summaries of any published research relevant to this hypothesis. H3: State a multivariate hypothesis predicting how the strength of the bivariate relationship is altered when controlling for the effects of a third variable. METHODS Data Definition Write at least one paragraph summarizing how the concepts identified in the statement of the problem and associated hypotheses are operationally defined in your study -- including any recoding or other data transformations. If you did recode any variables, then (for each recoded variable) include in the Appendices at the end of your report a bivariate table with the original (input) variable as the row variable and your recoded variable as the column variable. 1 Data Selection For the GSS 1972-2010 cumulative data file you can insert the following: Twenty-eight General Social Surveys (GSS) were conducted by the National Opinion Research Center (NORC) at the University of Chicago between 1972 and 2010 and combined into one pooled-sample file of 55,087 unweighted cases. Each survey from 1972 to 2004 was an independently drawn sample of English-speaking persons 18 years of age or over, living in noninstitutional arrangements within the United States. Starting in 2006 Spanish-speakers were added to the target population. Block quota sampling was used in 1972, 1973, and 1974 surveys and for half of the 1975 and 1976 surveys. Full probability sampling was employed in half of the 1975 and 1976 surveys and the 1977, 1978, 1980, 1982-1991, 1993-1998, 2000, 2002, 2004, 2006, 2008, and 2010 surveys. (http://sda.berkeley.edu/D3/GSS10/Doc/gs10.htm) If your tables were generated from fewer than the 28 years, then specify on your title page which years are included in your analyses. Include in the Appendices at the end of your report a bivariate table with YEAR as the row variable and your dependent variable as the column variable. Data Analysis Compose at least one paragraph identifying the analysis techniques used to test your hypotheses -- i.e., frequency-table analysis (interpreting random-sampling error margins) and contingency-table analysis (using the Rao-Scott correction for pooled samples as your chi-square test of statistical significance and Tau-b as your test of statistical association). 2 FINDINGS Test of the Univariate Hypothesis Give at least one paragraph describing the simple-frequency distribution of your dependent variable. The first sentence in this paragraph should restate the univariate hypothesis and tell whether the findings in Table 1 support, do not support, or contradict the univariate hypothesis. TABLE 1: [copy and paste your SDA frequency table here] Test of the Bivariate Hypothesis Write at least one paragraph interpreting the results of cross tabulating your dependent variable with your independent variable. The first sentence in this paragraph should restate the bivariate hypothesis and tell whether the data in Table 2 support, do not support, or contradict the bivariate hypothesis. You should report the Tau-b and Rao-Scott statistics to summarize the overall strength and statistical significance of the bivariate relationship. Only after doing so, should you focus on the group differences within the table. TABLE 2: [copy and paste your SDA bivariate table here] Test of Multivariate Hypothesis Compose at least a two- or three-paragraph interpretation of the effects of introducing your control variable on the bivariate relationship. The first sentence in this paragraph should restate the multivariate hypothesis and tell whether the data in Table 3 partial tables support, do not support, or contradict the multivariate hypothesis. You should report the Tau-b and Rao-Scott statistics to summarize the overall strength and statistical significance of the bivariate relationship in each of the partial tables. Only after doing so, should you focus on the group differences within the partial tables. TABLE 3: [copy and paste your SDA multivariate partial tables here] 3 IMPLICATIONS Substantive Conclusions Give at least one paragraph describing the implications of your findings for political decision-makers. Methodological Conclusions Write at least one paragraph describing the implications of your findings for other researchers interested in your problem. 4 REFERENCES Erikson, Robert S. and Kent L. Tedin. 2011. American Public Opinion. 8th edition. New York: Longman. Next reference Next reference 5 APPENDICES 6


