The following table gives the frequency distribution for people`s
advertisement
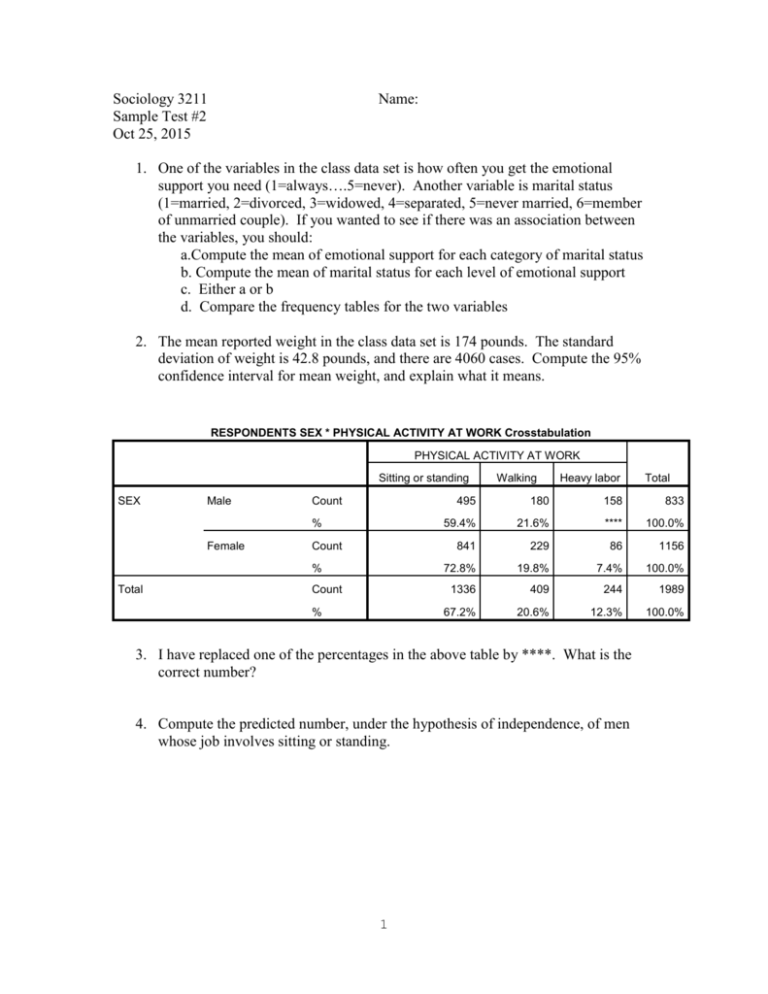
Sociology 3211 Sample Test #2 Oct 25, 2015 Name: 1. One of the variables in the class data set is how often you get the emotional support you need (1=always….5=never). Another variable is marital status (1=married, 2=divorced, 3=widowed, 4=separated, 5=never married, 6=member of unmarried couple). If you wanted to see if there was an association between the variables, you should: a.Compute the mean of emotional support for each category of marital status b. Compute the mean of marital status for each level of emotional support c. Either a or b d. Compare the frequency tables for the two variables 2. The mean reported weight in the class data set is 174 pounds. The standard deviation of weight is 42.8 pounds, and there are 4060 cases. Compute the 95% confidence interval for mean weight, and explain what it means. RESPONDENTS SEX * PHYSICAL ACTIVITY AT WORK Crosstabulation PHYSICAL ACTIVITY AT WORK Sitting or standing SEX Male Count % Female Count % Total Count % Walking Heavy labor 495 180 158 833 59.4% 21.6% **** 100.0% 841 229 86 1156 72.8% 19.8% 7.4% 100.0% 1336 409 244 1989 67.2% 20.6% 12.3% 100.0% 3. I have replaced one of the percentages in the above table by ****. What is the correct number? 4. Compute the predicted number, under the hypothesis of independence, of men whose job involves sitting or standing. 1 Total 5. Compute the residual for the number of men whose job involves sitting or standing. 6. Compute the standardized residual for the number of men whose job involves sitting or standing. 7. If the standardized residual for a cell is negative, that means that: a.you made a mistake in calculation b.the predicted value was larger than the actual value c.the predicted value was smaller than the actual value d.the predicted value was far from the actual value Report DRINK ANY ALCOHOLIC Mean BEVERAGES IN PAST 30 Educ. N Std. Deviation Yes 5.14 1980 .953 No 4.61 2168 1.096 Total 4.86 4148 1.063 8. Use the table to calculate the 95% confidence interval for the difference in mean education between people who drink and those who do not (use the exact method). Coefficientsa Standardized Unstandardized Coefficients Model 1 B Std. Error (Constant) .356 .128 EDUCATION LEVEL .128 .026 Coefficients Beta a. Dependent Variable: AVG ALCOHOLIC DRINKS PER DAY IN PAST 30 2 t .078 Sig. 2.793 .005 5.003 .000 This table gives the results from a regression of average drinks of alcohol per day on education (1=none, 2=elementary, 3=attended high school, 4=graduated high school, 5=attended college, 6=graduated college). 9. What is the predicted number of drinks per day for a person who graduated from college? 10. Suppose that a person who graduated from college has two drinks per day. What is his residual? 11. The following (imaginary) data show class standing (1=freshman …. 4=senior) and absences in some course. Use them to calculate the correlation. Class 1 1 2 2 2 2 2 3 3 4 4 4 absent 3 6 2 5 8 4 6 0 4 10 6 6 12. The correlation from the preceding question means that: a. students with a higher class standing tend to be absent more often b. students with a higher class standing tend to be absent less often c. students in the middle (sophomores and juniors) are absent less often than freshman and seniors d. class standing makes no difference for the number of absences 13. What are the smallest and largest possible values of a correlation? 3
