Sample size determinations again
advertisement
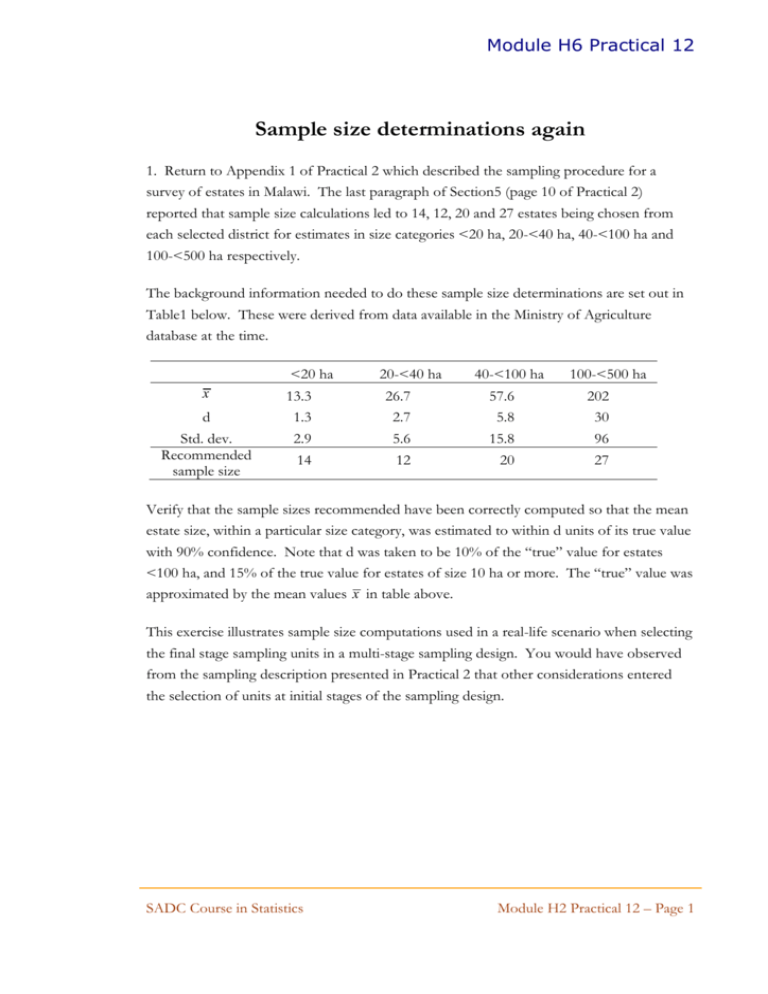
Module H6 Practical 12 Sample size determinations again 1. Return to Appendix 1 of Practical 2 which described the sampling procedure for a survey of estates in Malawi. The last paragraph of Section5 (page 10 of Practical 2) reported that sample size calculations led to 14, 12, 20 and 27 estates being chosen from each selected district for estimates in size categories <20 ha, 20-<40 ha, 40-<100 ha and 100-<500 ha respectively. The background information needed to do these sample size determinations are set out in Table1 below. These were derived from data available in the Ministry of Agriculture database at the time. <20 ha x d Std. dev. Recommended sample size 20-<40 ha 40-<100 ha 100-<500 ha 13.3 1.3 2.9 26.7 2.7 5.6 57.6 5.8 15.8 202 30 96 14 12 20 27 Verify that the sample sizes recommended have been correctly computed so that the mean estate size, within a particular size category, was estimated to within d units of its true value with 90% confidence. Note that d was taken to be 10% of the “true” value for estates <100 ha, and 15% of the true value for estates of size 10 ha or more. The “true” value was approximated by the mean values x in table above. This exercise illustrates sample size computations used in a real-life scenario when selecting the final stage sampling units in a multi-stage sampling design. You would have observed from the sampling description presented in Practical 2 that other considerations entered the selection of units at initial stages of the sampling design. SADC Course in Statistics Module H2 Practical 12 – Page 1 Module H6 Practical 12 2. The main purpose of this exercise is to highlight that increasing the sample size beyond a certain value does not always reduce the standard error of the quantity being estimated by a worthwhile amount. Open the file H6_data.xls and move to the worksheet named PopValues. This worksheet has 50000 records of values of a quantitative variate from a certain population in its first column. Ignore the second column for now. (a) First calculate the mean and standard deviation for the whole population and note your results below. Remember that these values would not be known in practice. mean = standard deviation = (b) Now look at columns C to J. These columns contain simple random samples of size 10, 100, 500, 1000, 5000, 10000, 20000 and 30000 drawn from the data in column A. Assume now that you are using one of these samples to estimate the population mean and a standard error for the population mean. Write down below the formula for the standard error of the mean (remembering to include the finite population correction), and verify (using Excel) that the standard errors based on each column are the same as those shown in the table below. Formula for the standard error of the sample mean is: Sample size Mean Std error of mean(with fpc) 10 20.698 0.7902 100 19.491 0.4010 500 19.744 0.1744 1000 20.023 0.1233 5000 20.050 0.0532 10000 20.007 0.0361 20000 20.021 0.0219 30000 19.998 0.0146 SADC Course in Statistics Std error of mean (without fpc) Module H2 Practical 12 – Page 2 Module H6 Practical 12 (c) Find the standard error of the mean without using the finite population correction (fpc), and enter your answers in the last column above. Comment on the effect that the fpc has on the standard error as the sample size increases. (d) You can also look at the effect of fpc by merely computing the value (1-n/N) for N=50000. In your opinion, how small should the fraction of the population sampled be, before you would be happy about ignoring it in the computation of the standard error of the mean. (e) Plot a graph of the standard error of the mean versus sample size, and sketch it below. What do you observe? If you had this information, what sample size would you have recommended? SADC Course in Statistics Module H2 Practical 12 – Page 3 Module H6 Practical 12 (f) Now consider data in column B. This contains 50000 records of people according to whether they have had malaria in the past year (1=yes, 0=no). For the purpose of this exercise, assume (unrealistically) that this constitutes a simple random sample drawn from a population of about 5 million people, i.e. it constitutes sampling 10% of the population. General knowledge of the population indicates that the period prevalence of malaria is about 4 per 10 persons in the population, and definitely lies between 20% and 70%. Ignoring the finite population correction, compute what sample size would be needed to estimate the period prevalence (proportion in the population who have had malaria in past year) so that the estimate is within 5% of the true value with 95% confidence. Do the necessary computations using Excel for a range of values of the true proportion p from 0.2 to 0.7. [Note: If the true value is 20%, then “within 5% of the true value” would give an estimate lying between 19% and 21%]. Assume that interest lies in getting a national-level estimate. (g) In the light of the sample sizes you obtained above, was the selection of a 10% sample, comprising 50000 people, justified? (h) There is often a myth that at least a 5% sample is needed in order to get reliable results. Would a 5% sample have been justified in the above case? What is the smallest likely sample needed to achieve the desired degree of precision? SADC Course in Statistics Module H2 Practical 12 – Page 4

