Statistics Linear Regression Worksheet
advertisement
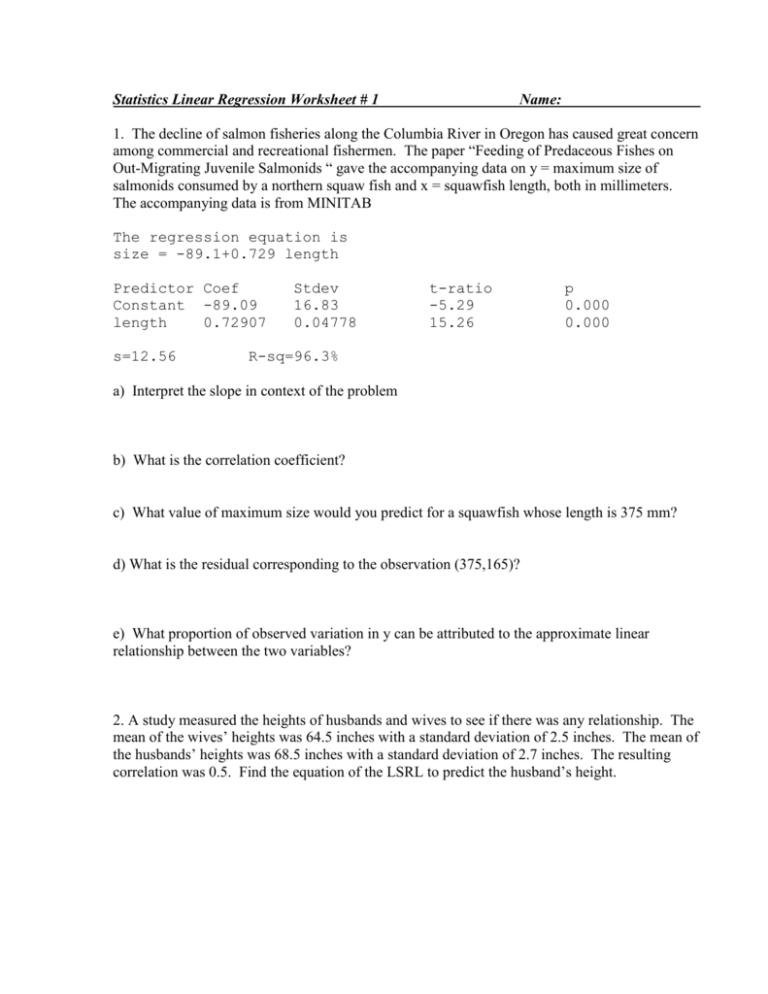
Statistics Linear Regression Worksheet # 1 Name: 1. The decline of salmon fisheries along the Columbia River in Oregon has caused great concern among commercial and recreational fishermen. The paper “Feeding of Predaceous Fishes on Out-Migrating Juvenile Salmonids “ gave the accompanying data on y = maximum size of salmonids consumed by a northern squaw fish and x = squawfish length, both in millimeters. The accompanying data is from MINITAB The regression equation is size = -89.1+0.729 length Predictor Coef Constant -89.09 length 0.72907 s=12.56 Stdev 16.83 0.04778 t-ratio -5.29 15.26 p 0.000 0.000 R-sq=96.3% a) Interpret the slope in context of the problem b) What is the correlation coefficient? c) What value of maximum size would you predict for a squawfish whose length is 375 mm? d) What is the residual corresponding to the observation (375,165)? e) What proportion of observed variation in y can be attributed to the approximate linear relationship between the two variables? 2. A study measured the heights of husbands and wives to see if there was any relationship. The mean of the wives’ heights was 64.5 inches with a standard deviation of 2.5 inches. The mean of the husbands’ heights was 68.5 inches with a standard deviation of 2.7 inches. The resulting correlation was 0.5. Find the equation of the LSRL to predict the husband’s height. 3. A copy machine dealer has data on the number x of copy machines at each of 89 customer locations and the number y of service calls in a month at each location. Summary calculations give x = 8.4, sx = 2.1, y = 14.2, sy = 3.8, and r = 0.86. a) What is the slope of the least squares regression line of number of service calls on number of copiers? b) What is the equation of the least squares regression line? 4. Lydia and Bob were searching the Internet to find information on air travel in the U.S. They found data on the number of commercial aircraft flying in the U.S. during the years 1990-1998. The dates were recorded as years since 1990. Thus, the year 1990 was recorded as year 0. They fit a least-squares regression line to the data. Part of the computer output for their regression are given below. a. What is the value of the slope of the least squares regression line? Interpret the slope in the context of this situation. b. What is the value of the intercept of the least squares regression line? Interpret the intercept in the context of this situation. c. What is the predicted number of commercial aircraft flying in 1992? d. If the residual for 1992 is 40, what is the actual number of commercial aircraft flying in 1992?
