Frequency distributions and graph
advertisement
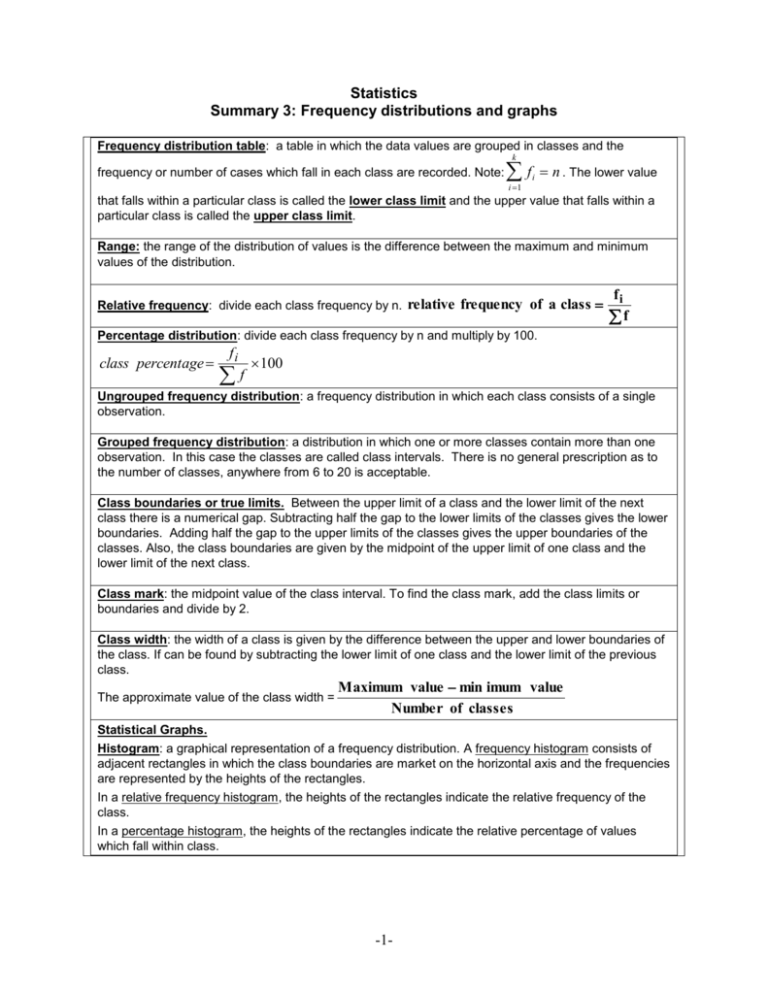
Statistics Summary 3: Frequency distributions and graphs Frequency distribution table: a table in which the data values are grouped in classes and the k frequency or number of cases which fall in each class are recorded. Note: f i 1 i n . The lower value that falls within a particular class is called the lower class limit and the upper value that falls within a particular class is called the upper class limit. Range: the range of the distribution of values is the difference between the maximum and minimum values of the distribution. Relative frequency: divide each class frequency by n. relative frequency of a class fi f Percentage distribution: divide each class frequency by n and multiply by 100. class percentage fi f 100 Ungrouped frequency distribution: a frequency distribution in which each class consists of a single observation. Grouped frequency distribution: a distribution in which one or more classes contain more than one observation. In this case the classes are called class intervals. There is no general prescription as to the number of classes, anywhere from 6 to 20 is acceptable. Class boundaries or true limits. Between the upper limit of a class and the lower limit of the next class there is a numerical gap. Subtracting half the gap to the lower limits of the classes gives the lower boundaries. Adding half the gap to the upper limits of the classes gives the upper boundaries of the classes. Also, the class boundaries are given by the midpoint of the upper limit of one class and the lower limit of the next class. Class mark: the midpoint value of the class interval. To find the class mark, add the class limits or boundaries and divide by 2. Class width: the width of a class is given by the difference between the upper and lower boundaries of the class. If can be found by subtracting the lower limit of one class and the lower limit of the previous class. The approximate value of the class width = Maximum value min imum value Number of classes Statistical Graphs. Histogram: a graphical representation of a frequency distribution. A frequency histogram consists of adjacent rectangles in which the class boundaries are market on the horizontal axis and the frequencies are represented by the heights of the rectangles. In a relative frequency histogram, the heights of the rectangles indicate the relative frequency of the class. In a percentage histogram, the heights of the rectangles indicate the relative percentage of values which fall within class. -1- Shapes of histograms: Positively skewed distribution or skewed to the right: a distribution that tails to the right. In this case the mean is greater than the median. Negatively skewed distribution or skewed to the left: a distribution that tails to the left. In this case the mean is smaller than the median Frequency polygons. A graph formed by joining the midpoints of the tops of successive bars in a histogram with straight lines is called a frequency polygon. To draw a frequency polygon, mark a dot above the midpoints of each class at a height equal to the frequency of that class, including classes of zero frequency at the beginning and at the end. Connect the dots with line segments Less than cumulative frequency distribution. A less than cumulative frequency distribution gives the total number of values that fall below the upper boundary of each class. More than cumulative frequency distribution. A more than cumulative frequency distribution gives the total number of values that fall above the lower boundary of each class. Ogive. The graph of a cumulative frequency distribution is called an ogive. It is obtained by drawing the frequency polygon of the cumulative frequency distribution. Problem: The K and R Personnel Service reported that annual salaries for department stores assistant managers range from $40,000 to $55,000. Assume that the following data are a sample of the annual salaries for department store assistant managers (data are in thousands of dollars). 52.0 43.4 53.2 50.8 48.1 47.6 54.9 52.3 44.6 51.0 45.0 51.6 53.8 48.1 52.3 46.0 54.6 46.6 43.7 45.6 45.4 47.5 52.3 54.3 40.0 41.8 52.3 52.5 50.4 49.9 a) Find the range of the distribution. Answer: Maximum value - Minimum value = 54.9 – 40.0 = 14.9 The range is 14.9 thousands of dollars b) The list of values is to be distributed in classes of width 3 thousand dollars where the lower limit of the first class is 40.0 thousand dollars. Find all the lower limits and all the upper limits. Answers. Lower limits are 40.0, 43.0, 46.0, 49.0, 52.0 Upper limits are 42.9, 45.9, 48.9, 51.9, 54.9 c) Find n, the number of values of the list. Answer. n = 30 values d) Tally, to find the frequency of values that corresponds to each class. Answer. Class frequencies are:2, 6, 6, 5, 11, e) Use the answers of parts a, b, c, d, to complete the following table Class Tally Class frequency Relative Class Class Class Limits width frequency Percentage mark Boundaries -2- Answer: Class Tally Class Limits width 40-42.9 3 43-45.9 3 46-48.9 3 49-51.9 3 52-54.9 3 Frequency f 2 6 6 5 11 Relative frequency 2/30=0.067 6/30=0.2 0.2 0.167 0.367 Class Percentage 6.7% 20% 20% 16.7% 36.7% Class mark 41.45 44.45 47.45 50.45 53.45 Class Boundaries 39.95-42.95 42.95-45.95 45.95-48.95 48.95-51.95 51.95-54.95 Stem-and-leaf displays. Quantitative data is divided into two portions - a stem and a leaf. The leaf for each stem are shown separately in a display. An advantage of a stem-and-leaf display over a frequency distribution is that no information on individual observations is lost. Example. Construct a stem-and-leaf display for the following data. Use the first digit at the stem. Arrange the leaves for each stem in increasing order. 14 16 21 23 18 24 32 21 19 33 38 15 18 35 27 22 25 31 14 17 36 25 20 29 34 11 18 32 14 23 Stem-and-leaf Stem 1 2 3 Leaf 1 4 0 1 1 2 4 1 2 4 2 3 5 3 4 6 7 8 3 4 5 5 6 8 8 5 8 7 9 9 Example. Construct a stem-and-leaf display for the following data. Use the first digit at the stem. Arrange the leaves for each stem in increasing order. Condense the stem-and-leaf display by grouping the stems as 0-2, 3-5, 6-9 14 16 21 23 18 41 53 24 32 73 9 85 41 76 19 62 33 38 15 18 35 48 52 40 29 34 4 11 77 65 3 67 71 27 18 32 98 22 25 8 31 14 17 45 53 36 25 83 20 62 7 32 4 14 23 6 Stem-and-leaf Stem 0-2 3-5 6-9 Leaf 9 3 8 4 7 4 6 * 4 6 8 9 5 8 4 2 3 8 5 1 6 4 2 2 * 1 1 8 0 2 5 7 2 * 3 6 1 7 * 5 3 * 8 Stem-and-leaf Stem 0-2 3-5 6-9 Leaf 3 4 4 6 7 8 9*1 4 4 4 5 6 7 8 8 8 9 *0 1 2 3 3 4 5 5 7 9 1 2 2 2 3 4 5 6 8 *0 1 1 5 8 *2 3 3 2 2 5 7 *1 3 6 7 * 3 5 * 8 -3- 7 5 1 8 4 *1 3 4 7 2 5 5 0 9 3 *3 2 3 Problem: A small college in the state of Missouri has 600 students enrolled in their freshman class. 360 of the students enrolled are males. Professor Clark uses his History class of 120 students in order to make some inferences about the college. a) Describe the population of the study. b) Describe the population of female students. c) What is the proportion of male students in the college? d) Is the proportion of male students in the college a parameter or a statistics? e) Based on the given information, predict the number of male students in Professor’s Clark history class. f) Professor Clark finds out that 40% of the students in his history class are education majors. Does the 40% education majors in his class represent a parameter or a statistics? g) If Professor Clark’s class is unbiased, that is, is representative of the college, predict the number of education major students in the college? Answers: A small college in the state of Missouri has 600 students enrolled in their freshman class. 360 of the students enrolled are males. Professor Clark uses his History class of 120 students in order to make some inferences about the college. a) Describe the population of the study. Answer: The 600 students enrolled in a small college in the state of Missouri b) Describe the population of female students. Answer: The 240 female students enrolled in the small college in the state of Montana. c) What is the proportion of male students in the college? Answer: 360 0.6 600 d) Is the proportion of male students in the college a parameter or a statistics Answer: Parameter e) Based on the given information, predict the number of male students in Professor’s Clark history class. Answer: (0.6)(120) = 72 f) Professor Clark finds out that 40% of the students in his history class are education majors. Does the 40% education majors in his class represent a parameter or a statistics? Answer: a statistics g) If Professor Clark’s class is unbiased, that is, is representative of the college, predict the number of education major students in the college? Answer: 40% of 600 = 240 -4-
