Friendly Windows / Generating a Table of Values for a Given Equation
advertisement
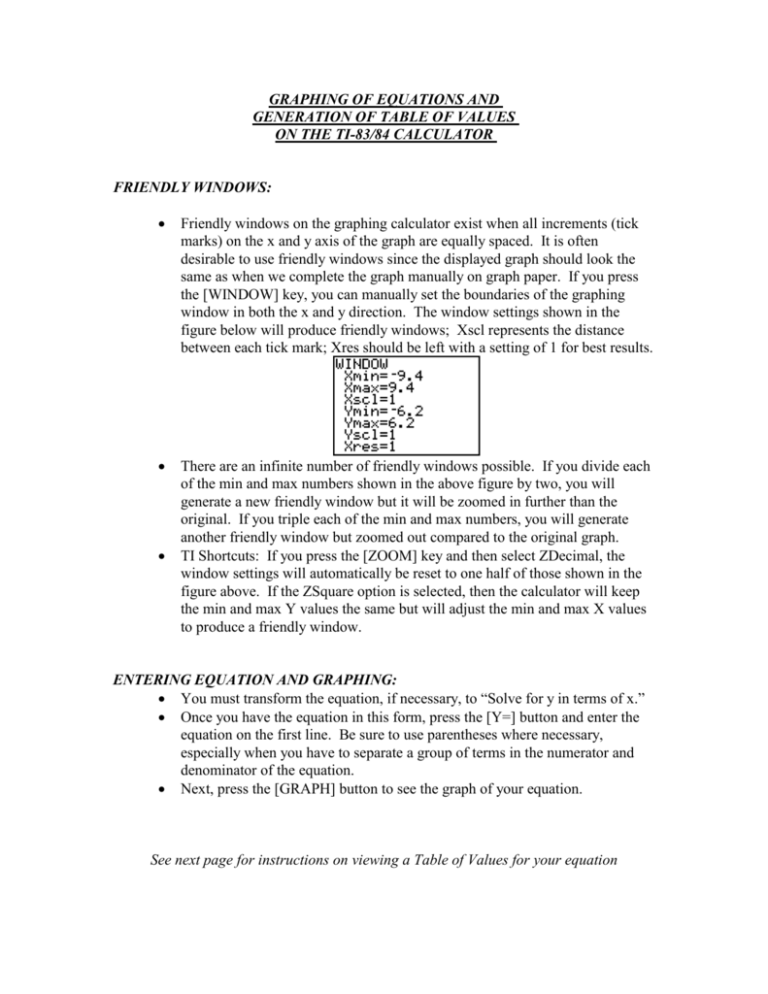
GRAPHING OF EQUATIONS AND GENERATION OF TABLE OF VALUES ON THE TI-83/84 CALCULATOR FRIENDLY WINDOWS: Friendly windows on the graphing calculator exist when all increments (tick marks) on the x and y axis of the graph are equally spaced. It is often desirable to use friendly windows since the displayed graph should look the same as when we complete the graph manually on graph paper. If you press the [WINDOW] key, you can manually set the boundaries of the graphing window in both the x and y direction. The window settings shown in the figure below will produce friendly windows; Xscl represents the distance between each tick mark; Xres should be left with a setting of 1 for best results. There are an infinite number of friendly windows possible. If you divide each of the min and max numbers shown in the above figure by two, you will generate a new friendly window but it will be zoomed in further than the original. If you triple each of the min and max numbers, you will generate another friendly window but zoomed out compared to the original graph. TI Shortcuts: If you press the [ZOOM] key and then select ZDecimal, the window settings will automatically be reset to one half of those shown in the figure above. If the ZSquare option is selected, then the calculator will keep the min and max Y values the same but will adjust the min and max X values to produce a friendly window. ENTERING EQUATION AND GRAPHING: You must transform the equation, if necessary, to “Solve for y in terms of x.” Once you have the equation in this form, press the [Y=] button and enter the equation on the first line. Be sure to use parentheses where necessary, especially when you have to separate a group of terms in the numerator and denominator of the equation. Next, press the [GRAPH] button to see the graph of your equation. See next page for instructions on viewing a Table of Values for your equation VIEWING A TABLE OF VALUES: The TI-83/84 will automatically generate a table of values for the equation you entered in the [Y=] screen. Go to the Table Set menu and enter a starting value of 0 and increment of 1. (Note that the triangle before Tbl is the Greek letter “delta” which represents the change in the Table value from one point to the next (more commonly known as the increment)). View the table by pressing [2nd][TABLE]. You will see two columns. The first column, labeled X, is the value picked by the calculator. The second column, labeled Y1 represents the calculated value of Y based on the equation you put into the [Y=] screen. Use the up and down arrows on the keypad to move up and down through the list. MORE ADVANCED TABLE OPERATIONS: In the Table Set menu, if you set the Independent (Indpnt) Variable, to Ask mode, then the Table of Values will be generated only for those values of the independent variable (generally x) that you enter. This option is especially useful if you need to find values of the equation for a number of specific values that might not otherwise be found in the “Auto” Table of Values (e.g. evaluate the equation for x = 2.345 or -1.0357). This option is used frequently in the Calculus study of limits.


