Asthma and Respiratory Distress Record Review, 2002-2005
advertisement
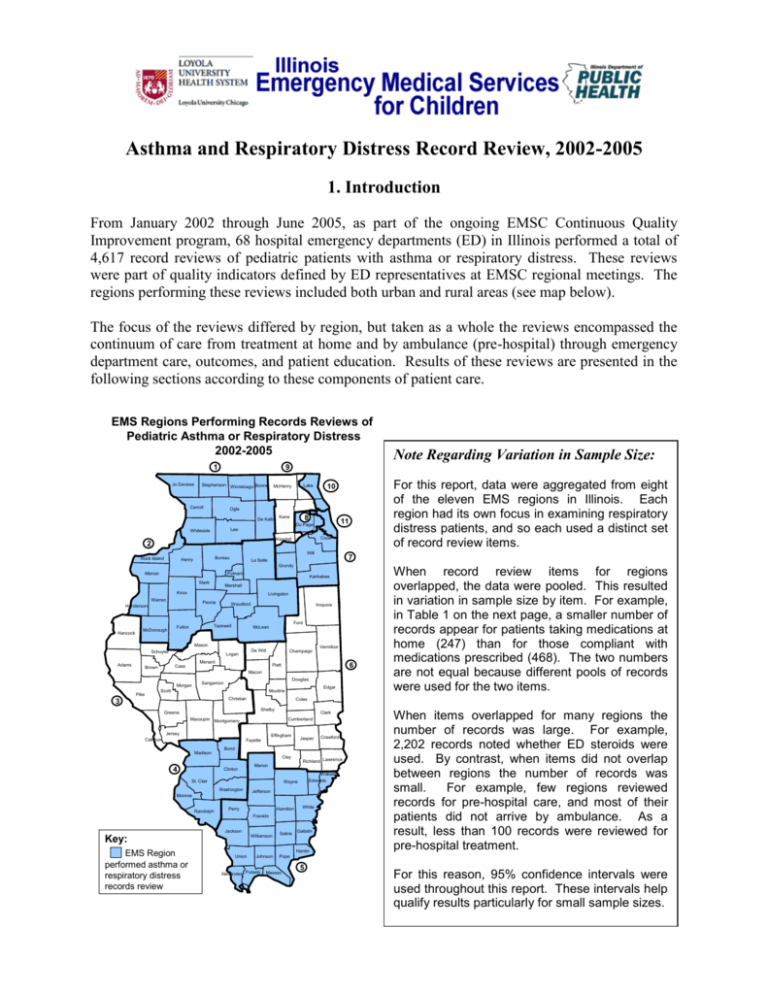
Asthma and Respiratory Distress Record Review, 2002-2005 1. Introduction From January 2002 through June 2005, as part of the ongoing EMSC Continuous Quality Improvement program, 68 hospital emergency departments (ED) in Illinois performed a total of 4,617 record reviews of pediatric patients with asthma or respiratory distress. These reviews were part of quality indicators defined by ED representatives at EMSC regional meetings. The regions performing these reviews included both urban and rural areas (see map below). The focus of the reviews differed by region, but taken as a whole the reviews encompassed the continuum of care from treatment at home and by ambulance (pre-hospital) through emergency department care, outcomes, and patient education. Results of these reviews are presented in the following sections according to these components of patient care. EMS Regions Performing Records Reviews of Pediatric Asthma or Respiratory Distress 2002-2005 1 Jo Daviess Stephenson Winnebago Boone Carroll Ogle Whiteside Lee Lake McHenry De Kalb 8 Kane 11 Cook Kendall 2 Will Bureau Henry For this report, data were aggregated from eight of the eleven EMS regions in Illinois. Each region had its own focus in examining respiratory distress patients, and so each used a distinct set of record review items. 10 Du Page Rock Island 7 La Salle Grundy Mercer Putnam Stark Kankakee Marshall Knox Livingston Warren Peoria Henderson Hancock McDonough Woodford Iroquois Ford Tazewell Fulton McLean Mason Schuyler De Witt Logan Champaign Menard Adams Vermilion 6 Piatt Cass Brown Macon Morgan Pike Douglas Sangamon Edgar Moultrie Scott Christian 3 Shelby Clark Cumberland Montgomery Jersey Effingham Calhoun Jasper Fayette Crawford Bond Madison 4 Clay Clinton Wabash Edwards Wayne Monroe Randolph Richland Lawrence Marion St. Clair Washington Jefferson Hamilton Perry White Franklin Jackson Williamson Key: EMS Region performed asthma or respiratory distress records review Saline Gallatin Hardin Union When record review items for regions overlapped, the data were pooled. This resulted in variation in sample size by item. For example, in Table 1 on the next page, a smaller number of records appear for patients taking medications at home (247) than for those compliant with medications prescribed (468). The two numbers are not equal because different pools of records were used for the two items. Coles Greene Macoupin Note Regarding Variation in Sample Size: 9 Johnson Alexander Pulaski When items overlapped for many regions the number of records was large. For example, 2,202 records noted whether ED steroids were used. By contrast, when items did not overlap between regions the number of records was small. For example, few regions reviewed records for pre-hospital care, and most of their patients did not arrive by ambulance. As a result, less than 100 records were reviewed for pre-hospital treatment. Pope Massac 5 For this reason, 95% confidence intervals were used throughout this report. These intervals help qualify results particularly for small sample sizes. 2. Treatment at Home For pediatric patients with respiratory distress, 60% took home medications or treatments before arriving at the emergency department (ED), and 81% reported compliance with their medications when they had received prescriptions (Table 1). Table 1. Treatments at Home Record Review Item Taking Home Meds/Tx Compliance with Medications Review Results Number Total Percent 247 411 60% 468 575 81% 95% Confidence Intervals Lower Upper 55% 65% 78% 84% 3. Pre-Hospital Care a) Pre-Hospital Assessment. For patients receiving pre-hospital care, either by Advanced Life Support (ALS) or Basic Life Support (BLS) ambulances, 89% of their records recorded respiratory effort and 99% recorded pulse oximetry (Table 2). For records with pulse oximetry available, 19% recorded SaO2 values of less than 92%. Table 2. Pre-Hospital Assessment Review Results Record Review Item Number Total Percent Respiratory Rate Documented 80 90 89% Initial Pulse Oximetry Documented 89 90 99% If Documented, Pulse Oximetry < 92% 16 83 19% 95% Confidence Intervals Lower Upper 80% 94% 93% 100% 12% 30% b) Pre-Hospital Treatment. For patients receiving ALS pre-hospital care, 83% were treated with at least one of epinephrine (4%), nebulizer (60%), and/or oxygen (50%), as shown in Figure 1. An insufficient number of BLS pre-hospital cases were reviewed to evaluate for treatments provided. Figure 1. Pre-Hospital ALS Treatment1 100% 80% 60% 40% 20% 0% Epinephrine Advanced Life Support (ALS) Tx Epinephrine Nebulizer Oxygen Nebulizer Review Results Number Total Percent 3 78 4% 47 78 60% 39 78 50% Oxygen 95% Confidence Intervals Lower Upper 1% 12% 49% 71% 39% 61% 4. Emergency Department Care a) Emergency Department Assessment. Assessment of pediatric respiratory distress patients was recorded at high levels for patient weight (92%), respiratory effort (90%), breath sounds (89%), respiratory rate (99%), pulse oximetry (93%), and mental status (91%), as shown in Table 3. Recorded less often were skin color (75%), blood pressure (55%), and patient height (23%). Table 3. Emergency Department Assessment Record Review Item Weight Documented Respiratory Effort Documented Breath Sounds Documented Respiratory Rate Documented Pulse Oximetry Documented Mental Status Documented Skin Color Documented Blood Pressure Documented Height Documented Review Results Number Total Percent 328 356 92% 1,333 1,483 90% 1,321 1,483 89% 1,038 1,051 99% 1,402 1,501 93% 1,352 1,484 91% 507 676 75% 136 247 55% 71 315 23% 95% Confidence Intervals Lower Upper 89% 95% 88% 91% 87% 91% 98% 99% 92% 95% 90% 92% 72% 78% 49% 61% 18% 28% ___________________________________________________________________ 1Note: In this and all subsequent charts, error bars represent 95% confidence intervals. b) Emergency Department Treatment of Both Asthma and Respiratory Distress Patients. Treatment of asthma and respiratory distress patients included 83% receiving nebulizer, 59% steroids, 23% oxygen, and 4% epinephrine, as shown in Figure 2. Figure 2. Emergency Department Treatment 100% 80% 60% 40% 20% 0% Epinephrine Record Review Item Epinephrine Nebulizer Oxygen Steroids Nebulizer Oxygen Review Results Number Total Percent 14 327 4% 1,284 1,552 83% 74 327 23% 1,299 2,202 59% Steroids 95% Confidence Intervals Lower Upper 2% 7% 81% 85% 18% 28% 57% 61% For patients receiving nebulizer therapy, 71% received one treatment, 22% two treatments, and 7% three or more treatments. Medications included Albuterol (50%), Albuterol and Atrovent (34%), Xopenex (14%), Racemic Epi (8%), Xopenex and Atrovent (2%), and Atrovent alone (1%), as shown in Figure 3. (Note: These values add up to more than 100% because the same patient may have received different medications during therapy.) Figure 3. Medication Distribution 100% 80% 60% 40% 20% 0% Albuterol Albuterol and Atrovent Medication Distribution Albuterol Albuterol and Atrovent Atrovent Racemic Epi Xopenex Xopenex and Atrovent Atrovent Racemic Epi Xopenex Review Results Number Total Percent 365 731 50% 250 731 34% 10 731 1% 58 731 8% 103 731 14% 11 731 2% Xopenex and Atrovent 95% Confidence Intervals Lower Upper 46% 54% 31% 38% 1% 3% 6% 10% 12% 17% 1% 3% c) Emergency Department Treatment of Asthma Patients. For asthma patients specifically, asthma flow sheets were used in 43% of records, evaluation peak flow in 36%, and posttreatment peak flow in 34% (Table 4). Table 4. Asthma Patient Treatment Record Review Item Asthma Flowsheet Used Evaluation Peak Flow Completed Post-Tx Peak Flow Completed Review Results Number Total Percent 399 937 43% 127 354 36% 122 354 34% 95% Confidence Intervals Lower Upper 39% 46% 31% 41% 30% 40% d) Emergency Department Reassessment. Reassessments were performed at much lower rates than initial assessments. These included 57% documentation of breath sounds, 72% respiratory rate, 64% pulse oximetry, and 70% mental status (Table 5). By contrast, initial assessments recorded 89% documentation of breath sounds, 99% respiratory rate, 93% pulse oximetry, and 91% mental status. Table 5. Emergency Department Reassessment Review Results Number Total Percent 481 850 57% 650 898 72% 578 898 64% 153 219 70% Record Review Item Breath Sounds Documented Respiratory Rate Documented Pulse Oximetry Documented Mental Status Documented 95% Confidence Intervals Lower Upper 53% 60% 69% 75% 61% 67% 63% 76% 5. Outcomes Outcome measurements showed very high levels of patient improvement. These included 95% improvement in the work of breathing, 98% improved (cleared) after treatment, and 96% not having 48-hour-return visits to the same ED (Figure 4). It is important to note that the return rate only captures patients returning to the same facility. If a patient needed treatment within 48 hours at another emergency department, clinic, or physician’s office, this information was not available. After ED care, 84% of patients went home, 14% were admitted, and 2% were transferred. No mortalities were recorded among these patients. Figure 4. Outcomes 100% 80% 60% 40% 20% 0% Improvement (Clearing) with Treatment Record Review Item Improvement (Clearing) with Treatment Work of Breathing Improved No 48-Hour-Return to Same ED Work of Breathing Improved No 48-Hour-Return to Same ED Review Results Number Total Percent 692 704 98% 274 288 95% 1,652 1,719 96% 95% Confidence Intervals Lower Upper 97% 99% 92% 97% 95% 97% 6. Patient Education In patient education, high percentages of records recorded patient teaching in areas directly relating to the ED and immediate treatment, such as 87% for home use of medications, 90% when to return to the ED, and 92% for follow-up referral. Lower percentages were found for less directly ED-related topics such as 39% for using a metered-dose inhaler, 49% for potential triggers, 42% for smoking cessation, and 51% for an asthma action plan. Figure 5. Patient Education 100% 80% 60% 40% 20% 0% Medications Meteredfor Home Dose Use Inhaler (MDI) Patient Education Provided Medications for Home Use Metered-Dose Inhaler (MDI) Potential Triggers Smoking Cessation Asthma Action Plan When to Return to ED Follow-up Referral Potential Triggers Smoking Asthma When to Cessation Action Plan Return to ED Review Results Number Total Percent 557 639 87% 177 451 39% 253 517 49% 147 354 42% 211 413 51% 594 661 90% 551 596 92% Follow -up Referral 95% Confidence Intervals Lower Upper 84% 90% 35% 44% 45% 53% 36% 47% 46% 56% 87% 92% 90% 94% . 7. Conclusion This report presents a baseline of descriptive information available to the Illinois EMSC program regarding care of pediatric asthma and respiratory distress patients. It may provide useful benchmark data for later evaluations of care in this area.

