Calculator Activity: Contingency Tables
advertisement
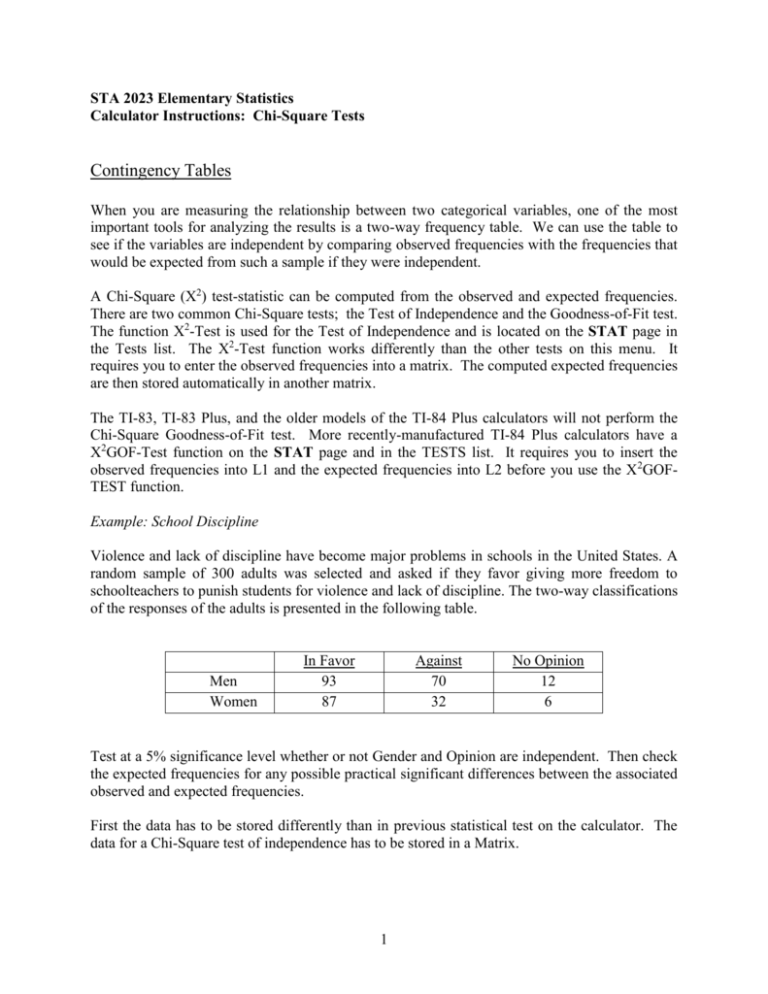
STA 2023 Elementary Statistics Calculator Instructions: Chi-Square Tests Contingency Tables When you are measuring the relationship between two categorical variables, one of the most important tools for analyzing the results is a two-way frequency table. We can use the table to see if the variables are independent by comparing observed frequencies with the frequencies that would be expected from such a sample if they were independent. A Chi-Square (Χ2) test-statistic can be computed from the observed and expected frequencies. There are two common Chi-Square tests; the Test of Independence and the Goodness-of-Fit test. The function Χ2-Test is used for the Test of Independence and is located on the STAT page in the Tests list. The Χ2-Test function works differently than the other tests on this menu. It requires you to enter the observed frequencies into a matrix. The computed expected frequencies are then stored automatically in another matrix. The TI-83, TI-83 Plus, and the older models of the TI-84 Plus calculators will not perform the Chi-Square Goodness-of-Fit test. More recently-manufactured TI-84 Plus calculators have a X2GOF-Test function on the STAT page and in the TESTS list. It requires you to insert the observed frequencies into L1 and the expected frequencies into L2 before you use the X2GOFTEST function. Example: School Discipline Violence and lack of discipline have become major problems in schools in the United States. A random sample of 300 adults was selected and asked if they favor giving more freedom to schoolteachers to punish students for violence and lack of discipline. The two-way classifications of the responses of the adults is presented in the following table. Men Women In Favor 93 87 Against 70 32 No Opinion 12 6 Test at a 5% significance level whether or not Gender and Opinion are independent. Then check the expected frequencies for any possible practical significant differences between the associated observed and expected frequencies. First the data has to be stored differently than in previous statistical test on the calculator. The data for a Chi-Square test of independence has to be stored in a Matrix. 1 STA 2023 Elementary Statistics Calculator Instructions: Chi-Square Tests Press the 2nd key and then the x-1 key to get to MATRX. Press the ► key twice to highlight EDIT. Press the ENTER key. After MATRIX [A] type in 2 x3. The 2 represents the number of rows in the table. The 3 represents the number of columns in the table. Enter the data values into the matrix as they appear in the table. Press the STAT key. Press the ► key twice to get to TESTS. Press the ALPHA key and then the PRGM key to get to C: X2-Test… The X2-Test output shows: That the observed values are in matrix A That the expected values are in matrix B Move the cursor to Calculate and press the ENTER key. This X2-Test output show the: Test statistic: X2=8.252773109 P-value: P=.0161410986 Degrees of freedom: df=2 Since the p-value of .016 is less than the significance level of .05 we reject the null hypothesis that row and column variables are independent. We have evidence that gender does influence opinions concerning school discipline. 2 STA 2023 Elementary Statistics Calculator Instructions: Chi-Square Tests The see the expected frequencies Press the 2nd key and then the x-1 key. Press the ► key twice to get to EDIT. Press the number 2 key to get to [B]. Comparisons such as 70 men were against giving more freedom to teachers to punish kids and we only expected 59.5 of them to be against it if the variables are really independent. Example: Gender and Cell Phones A researcher wanted to study the relationship between gender and owning cell phones. She took a sample of 2000 adults and obtained the information given in the following table. Own Cell Phone Men Women Do Not Own Cell Phone 640 440 450 470 Test at a 1% level of significance whether or not gender and owning cell phones are independent. Then check the expected frequencies for any possible practical significant differences between the associated observed and expected frequencies. Remember the data has to be stored differently than in previous statistical test on the calculator. The data for a Chi-Square test of independence has to be stored in a Matrix. Press the 2nd key and then the x-1 key to get to MATRX. Press the ► key twice to highlight EDIT. Press the ENTER key. 3 After MATRIX [A] type in 2 x2. The 2 represents the number of rows in the table. The 2 represents the number of columns in the table. Press the ENTER key. Enter the data values into the matrix as they appear in the table. Press the STAT key. Press the ► key twice to get to TESTS. Press the ALPHA key and then the PRGM key to get to C: X2-Test… The X2-Test output shows: That the observed values are in matrix A That the expected values are in matrix B Move the cursor to Calculate and press the ENTER key. This X2-Test output show the: Test statistic: X2=21.44552843 P-value: P=3.6402395E-6 Degrees of freedom: df=1 Since the p-value is less than the significance level of .01 we reject the null hypothesis that row and column variables are independent. We have evidence that gender does influence cell phone ownership. The see the expected frequencies Press the 2nd key and then the x-1 key. Press the ► key twice to get to EDIT. Press the number 2 key to get to [B]. Comparisons such as 640 men owned cell phones can be compare to 588.6 that we expected gives evidence that gender does influence cell phone ownership. 4
