Supplementary statistical methods for gene expression analysis
advertisement
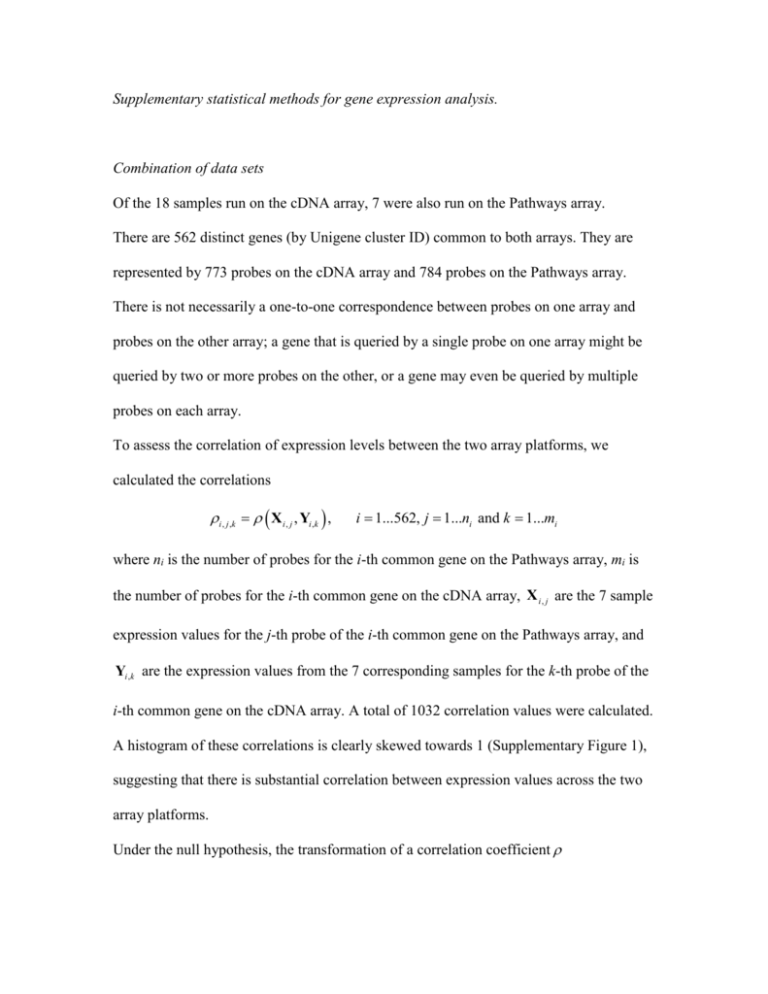
Supplementary statistical methods for gene expression analysis. Combination of data sets Of the 18 samples run on the cDNA array, 7 were also run on the Pathways array. There are 562 distinct genes (by Unigene cluster ID) common to both arrays. They are represented by 773 probes on the cDNA array and 784 probes on the Pathways array. There is not necessarily a one-to-one correspondence between probes on one array and probes on the other array; a gene that is queried by a single probe on one array might be queried by two or more probes on the other, or a gene may even be queried by multiple probes on each array. To assess the correlation of expression levels between the two array platforms, we calculated the correlations i , j ,k X i , j , Yi ,k , i 1...562, j 1...ni and k 1...mi where ni is the number of probes for the i-th common gene on the Pathways array, mi is the number of probes for the i-th common gene on the cDNA array, X i , j are the 7 sample expression values for the j-th probe of the i-th common gene on the Pathways array, and Yi ,k are the expression values from the 7 corresponding samples for the k-th probe of the i-th common gene on the cDNA array. A total of 1032 correlation values were calculated. A histogram of these correlations is clearly skewed towards 1 (Supplementary Figure 1), suggesting that there is substantial correlation between expression values across the two array platforms. Under the null hypothesis, the transformation of a correlation coefficient Tn n 2 1 2 is approximately Student’s T with n - 2 degrees of freedom [ref: Mathematical Statistics, Peter Bickel & Kjell Doksum, Holden-Day, Oakland CA 1977, p 221]. So, under the null hypothesis of no correlation between the cDNA array and the Pathways array, Ti , j ,k n 2 i , j ,k 1 i2, j ,k is approximately Student’s T with 5 degrees of freedom. The one- sided Kolmogorov-Smirnov test for comparing distributions is highly significant (p < 0.00001), so we reject the null hypothesis, and conclude that the correlation between the two arrays is not random.

