Confidence Interval Estimate of the Mean
advertisement
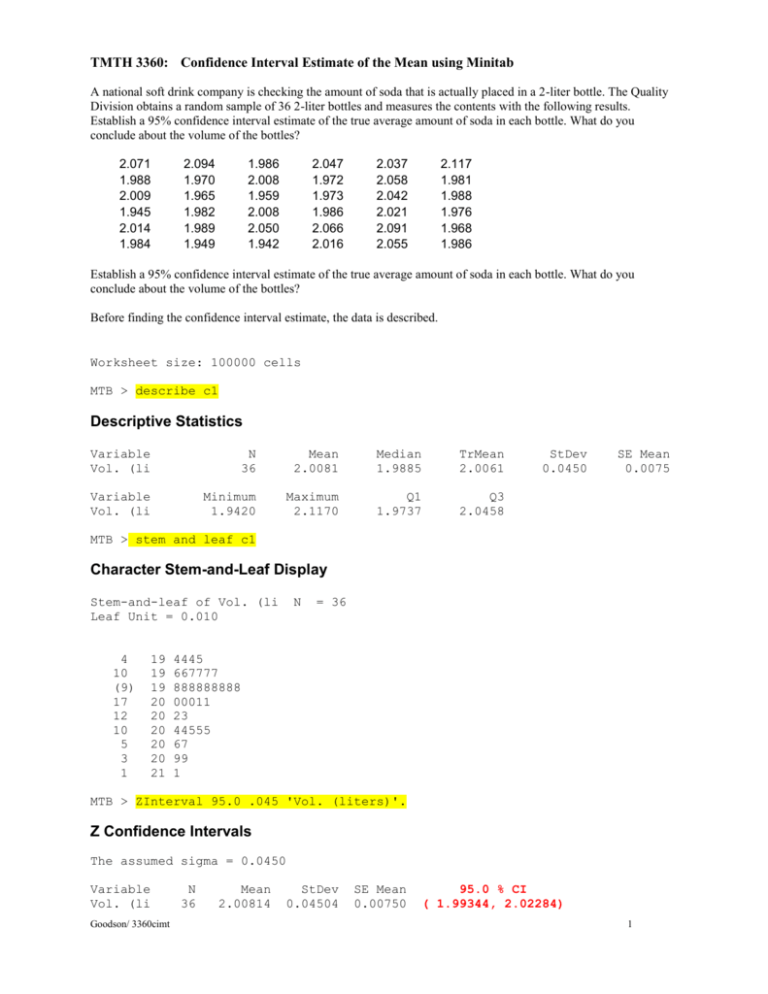
TMTH 3360: Confidence Interval Estimate of the Mean using Minitab A national soft drink company is checking the amount of soda that is actually placed in a 2-liter bottle. The Quality Division obtains a random sample of 36 2-liter bottles and measures the contents with the following results. Establish a 95% confidence interval estimate of the true average amount of soda in each bottle. What do you conclude about the volume of the bottles? 2.071 1.988 2.009 1.945 2.014 1.984 2.094 1.970 1.965 1.982 1.989 1.949 1.986 2.008 1.959 2.008 2.050 1.942 2.047 1.972 1.973 1.986 2.066 2.016 2.037 2.058 2.042 2.021 2.091 2.055 2.117 1.981 1.988 1.976 1.968 1.986 Establish a 95% confidence interval estimate of the true average amount of soda in each bottle. What do you conclude about the volume of the bottles? Before finding the confidence interval estimate, the data is described. Worksheet size: 100000 cells MTB > describe c1 Descriptive Statistics Variable Vol. (li N 36 Mean 2.0081 Median 1.9885 TrMean 2.0061 Variable Vol. (li Minimum 1.9420 Maximum 2.1170 Q1 1.9737 Q3 2.0458 StDev 0.0450 SE Mean 0.0075 MTB > stem and leaf c1 Character Stem-and-Leaf Display Stem-and-leaf of Vol. (li Leaf Unit = 0.010 4 10 (9) 17 12 10 5 3 1 19 19 19 20 20 20 20 20 21 N = 36 4445 667777 888888888 00011 23 44555 67 99 1 MTB > ZInterval 95.0 .045 'Vol. (liters)'. Z Confidence Intervals The assumed sigma = 0.0450 Variable Vol. (li Goodson/ 3360cimt N 36 Mean 2.00814 StDev 0.04504 SE Mean 0.00750 95.0 % CI ( 1.99344, 2.02284) 1 Conclusion: With 95% confidence, it is estimated that the average contents of the bottles of soda is between 1.993 liters and 2.023 liters. The company appears to provide a volume of soda that is consistent with the specified amount )2liters. Note: if all possible samples of size 36 were taken and the mean was calculated for each sample, 95% of the intervals would contain the true population mean. Goodson/ 3360cimt 2


