SPSS II – Solutions
advertisement
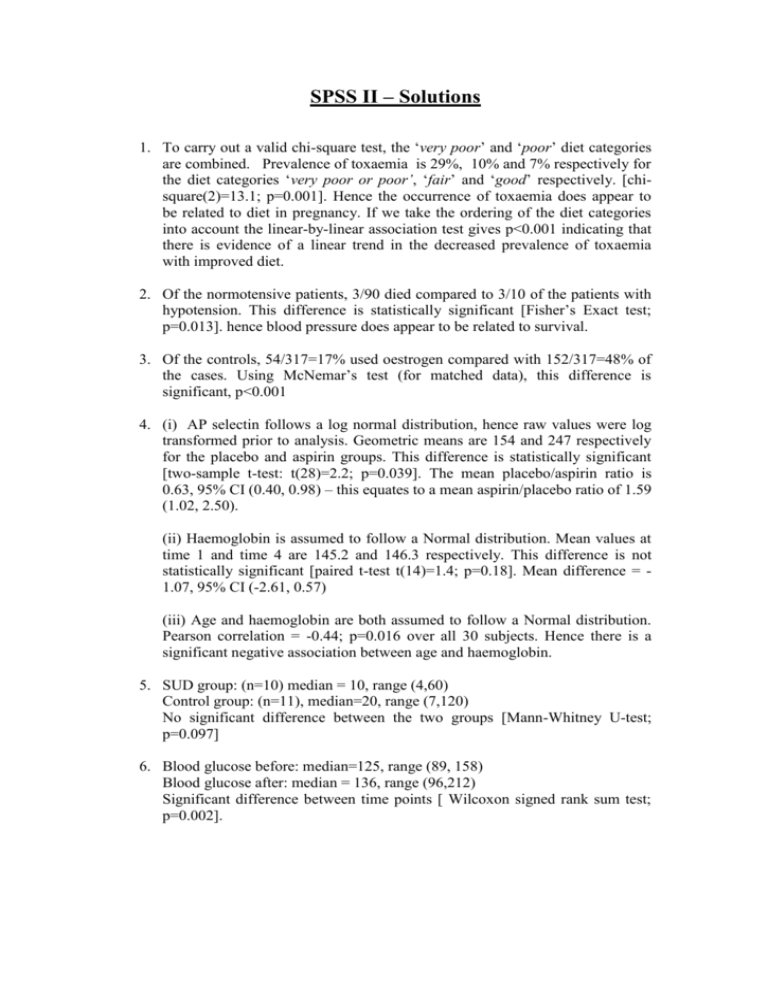
SPSS II – Solutions 1. To carry out a valid chi-square test, the ‘very poor’ and ‘poor’ diet categories are combined. Prevalence of toxaemia is 29%, 10% and 7% respectively for the diet categories ‘very poor or poor’, ‘fair’ and ‘good’ respectively. [chisquare(2)=13.1; p=0.001]. Hence the occurrence of toxaemia does appear to be related to diet in pregnancy. If we take the ordering of the diet categories into account the linear-by-linear association test gives p<0.001 indicating that there is evidence of a linear trend in the decreased prevalence of toxaemia with improved diet. 2. Of the normotensive patients, 3/90 died compared to 3/10 of the patients with hypotension. This difference is statistically significant [Fisher’s Exact test; p=0.013]. hence blood pressure does appear to be related to survival. 3. Of the controls, 54/317=17% used oestrogen compared with 152/317=48% of the cases. Using McNemar’s test (for matched data), this difference is significant, p<0.001 4. (i) AP selectin follows a log normal distribution, hence raw values were log transformed prior to analysis. Geometric means are 154 and 247 respectively for the placebo and aspirin groups. This difference is statistically significant [two-sample t-test: t(28)=2.2; p=0.039]. The mean placebo/aspirin ratio is 0.63, 95% CI (0.40, 0.98) – this equates to a mean aspirin/placebo ratio of 1.59 (1.02, 2.50). (ii) Haemoglobin is assumed to follow a Normal distribution. Mean values at time 1 and time 4 are 145.2 and 146.3 respectively. This difference is not statistically significant [paired t-test t(14)=1.4; p=0.18]. Mean difference = 1.07, 95% CI (-2.61, 0.57) (iii) Age and haemoglobin are both assumed to follow a Normal distribution. Pearson correlation = -0.44; p=0.016 over all 30 subjects. Hence there is a significant negative association between age and haemoglobin. 5. SUD group: (n=10) median = 10, range (4,60) Control group: (n=11), median=20, range (7,120) No significant difference between the two groups [Mann-Whitney U-test; p=0.097] 6. Blood glucose before: median=125, range (89, 158) Blood glucose after: median = 136, range (96,212) Significant difference between time points [ Wilcoxon signed rank sum test; p=0.002]. SPSS2 – Solutions contd 7. Red cell folate follows a reasonable Normal distribution. The mean values are 316.6, 256.4 and 278.0 for groups I, II and II respectively. There are significant differences between the groups (one-factor ANOVA, F(2,19)=3.71; P=0.044). Using Scheffe’s multiple comparison test the difference between groups I and II is identified to be statistically significant (p=0.045). Patients receiving 50% oxygen mixture continuously for 24 hours have a significantly higher red cell folate level compared with patients receiving 50% oxygen mixture during the operation only. 8. Headache activity score does not follow a Normal distribution. The median values are 74, 96 and –36 for the ‘relax+bio’, ‘relax’ and ‘untreated’ groups respectively. The difference between the three groups is of borderline significance (Kruskal-Wallis; p=0.057). The groups are small, hence comparison of each pair of groups with Mann-Whitney U-tests is not very powerful (and in fact all three P values are greater than 0.05 even without allowing for multiple comparisons). However, it is reasonable to consider whether the two actively treated groups together did better than the untreated controls (Mann-Whitney U-test; p=0.032), supporting the suggestion that both treatments are beneficial but that the study is too small to be able to distinguish them.


