SPSS
advertisement
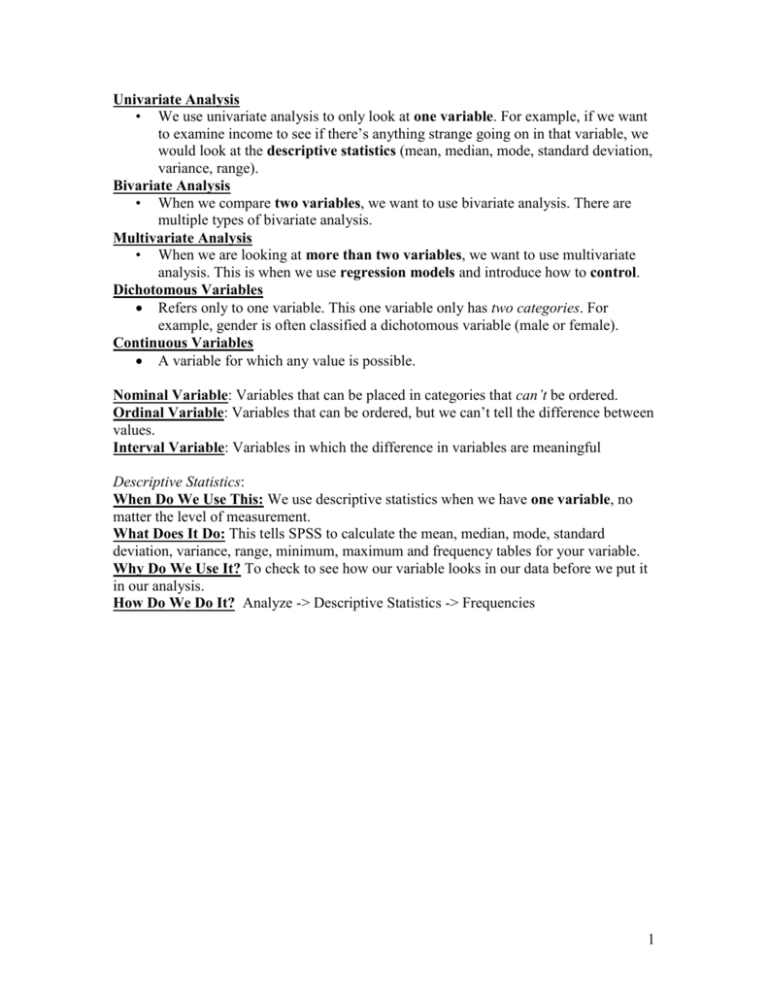
Univariate Analysis • We use univariate analysis to only look at one variable. For example, if we want to examine income to see if there’s anything strange going on in that variable, we would look at the descriptive statistics (mean, median, mode, standard deviation, variance, range). Bivariate Analysis • When we compare two variables, we want to use bivariate analysis. There are multiple types of bivariate analysis. Multivariate Analysis • When we are looking at more than two variables, we want to use multivariate analysis. This is when we use regression models and introduce how to control. Dichotomous Variables Refers only to one variable. This one variable only has two categories. For example, gender is often classified a dichotomous variable (male or female). Continuous Variables A variable for which any value is possible. Nominal Variable: Variables that can be placed in categories that can’t be ordered. Ordinal Variable: Variables that can be ordered, but we can’t tell the difference between values. Interval Variable: Variables in which the difference in variables are meaningful Descriptive Statistics: When Do We Use This: We use descriptive statistics when we have one variable, no matter the level of measurement. What Does It Do: This tells SPSS to calculate the mean, median, mode, standard deviation, variance, range, minimum, maximum and frequency tables for your variable. Why Do We Use It? To check to see how our variable looks in our data before we put it in our analysis. How Do We Do It? Analyze -> Descriptive Statistics -> Frequencies 1 2 3 Calculating a Chi-Square: When Do We Use This: We use chi-square when we have one variable, no matter the level of measurement. What Does It Do: This tells SPSS to calculate our chi-square coefficient. Why Do We Use It? To check to see how if our variable acts differently than how we expect it to by chance. If It is zero, then we accept the null. How Do We Do It? Analyze -> Nonparametric Tests -> Chi-Square 4 5 Crosstabs When Do We Use This: We use crosstabs when we have two ordinal variables. What Does It Do: SPSS will generate a table that will cross tabulate the frequencies of the different categories in your variables. Why Do We Use It? To estimate the relationship between two variables. This is like doing a scatterplot, just with results. How Do We Do It? Analyze -> Descriptive Statistics -> Crosstab 6 Calculating Gamma: When Do We Use This: We use gamma when we have two ordinal variables. What Does It Do: This performs a calculation in SPSS (which we went over in class yesterday) that checks to see if our relationship is significant. Why Do We Use It? To check to see if there’s a relationship between two ordinal variables. Gamma runs from -1 to 1 and we also look at the significance. How Do We Do It? Analyze -> Descriptive Statistics -> Crosstab (Click on Statistics) 7 8 Calculating a T-Test: When Do We Use This: We use a t-test when we have two or more variables. Usually, we’re comparing groups based on a dichotomous variable (independent) on a continuous variable (dependent). Although your independent can also be continuous. What Does It Do: A t-test finds out if there was a difference in the average means of one group versus another and finds the significance of that relationship. Why Do We Use It? To check to see how two variables relate to each other. If two groups significantly differ from each other, than that relationship is significant. How Do We Do It? Analyze -> Compare Means -> Independent Samples T-Test 9 10 Regression: When Do We Use This: We use regression when we have two interval variables. What Does It Do: Regression finds the regression by plotting the two variables on a scatterplot and finding the slope of a line between two variables. Why Do We Use It? To see if there’s a relationship between our two interval level variables. How Do We Do It? Analyze -> Regression -> Linear 11 12 Boxplots: When Do We Use This: We use boxplots to when we have either one or two variables. Boxplots should only be used with interval variables, although this varies. What Does It Do: This tells SPSS to calculate descriptive statistics visually. Why Do We Use It? It is a visual representation of our descriptive statistics when we have one variable. It also tells us the relationship between two variables. How Do We Do It? Graphs -> Interactive -> Boxplot 13 14 Scatterplots: When Do We Use This: We use scatterplots and dot graphs for two interval level variables. What Does It Do: This tells SPSS to plot the values of one variable against another on a X-Y graph. Why Do We Use It? This is a visual representation of a regression. It tells us the relationship between two interval variables. How Do We Do It? Graphs -> Interactive -> Scatterplot 15 16 17 18 19 If you have a nominal variable, that’s fine. However, you need to be careful. You can’t really tell much from comparing two nominal variables to each other, so if you have two nominal variables, you may want to reconsider your variables. Also, since we can’t order the categories on a nominal variable, having it as your dependent variable doesn’t make too much sense empirically. The data can’t tell you anything if the categories aren’t ordered. There is a possibility you may have to re-code your variable to make it work in data analysis, but we probably want to avoid this. You can actually have a nominal variable as an independent variable and an interval variable as a dependent variable in a regression. These are the types of tests you would generally perform for each variable and relationships. These is NOT an exhaustive list. It’s only a general guideline. You should always think about your data and variables before ruling anything out. EVERY SITUATION IS DIFFERENT. (Note, consult Salkind for how to recode variables in SPSS.) • Univariate Statistics: Always calculate descriptive statistics on your variables. • Always calculate chi-square on your variables. Bivariate Statistics: Independent-Dependent Relationship (in data analysis): Nominal-Nominal: Crosstab, Re-code 20 Nominal-Ordinal: Crosstab, Phi/Cramer’s V (Gamma) Nominal-Interval: T-test, Regression Analysis Ordinal-Nominal: Crosstab, Re-code Ordinal-Ordinal: Crosstab, Gamma Ordinal-Interval: T-test, Boxplots Interval-Nominal: Crosstab, Re-code Interval-Ordinal: Crosstab, Boxplots, Re-code Interval-Interval: T-Test, Regression Analysis, Boxplots, Scatterplots 21
