Tipping
advertisement
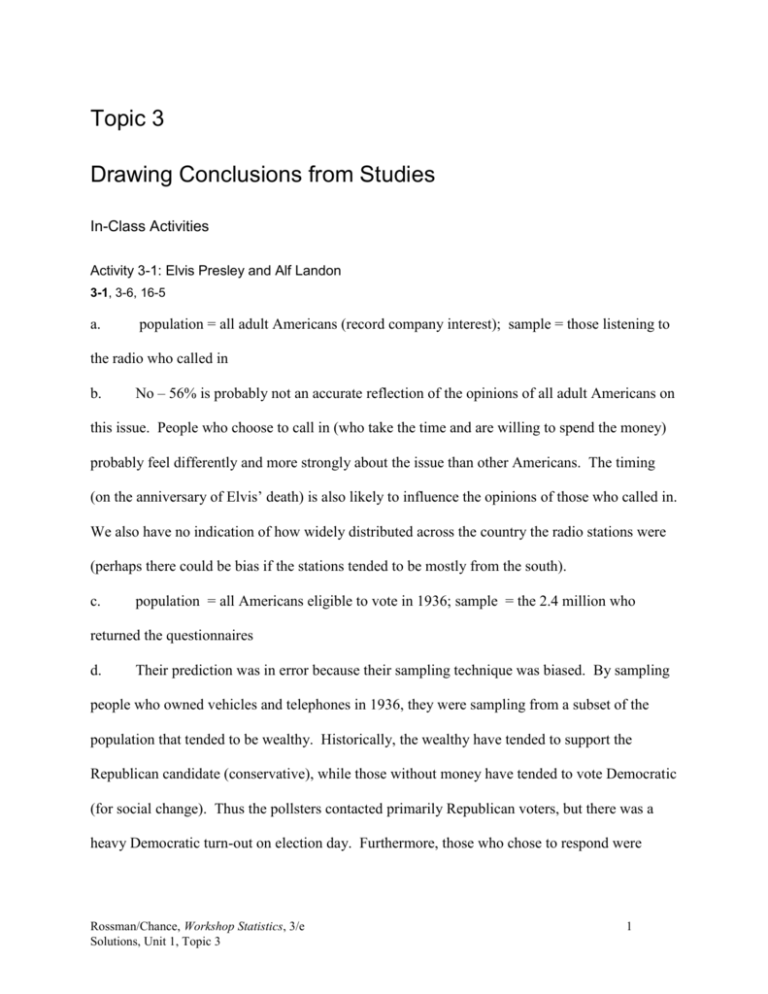
Topic 3 Drawing Conclusions from Studies In-Class Activities Activity 3-1: Elvis Presley and Alf Landon 3-1, 3-6, 16-5 a. population = all adult Americans (record company interest); sample = those listening to the radio who called in b. No – 56% is probably not an accurate reflection of the opinions of all adult Americans on this issue. People who choose to call in (who take the time and are willing to spend the money) probably feel differently and more strongly about the issue than other Americans. The timing (on the anniversary of Elvis’ death) is also likely to influence the opinions of those who called in. We also have no indication of how widely distributed across the country the radio stations were (perhaps there could be bias if the stations tended to be mostly from the south). c. population = all Americans eligible to vote in 1936; sample = the 2.4 million who returned the questionnaires d. Their prediction was in error because their sampling technique was biased. By sampling people who owned vehicles and telephones in 1936, they were sampling from a subset of the population that tended to be wealthy. Historically, the wealthy have tended to support the Republican candidate (conservative), while those without money have tended to vote Democratic (for social change). Thus the pollsters contacted primarily Republican voters, but there was a heavy Democratic turn-out on election day. Furthermore, those who chose to respond were Rossman/Chance, Workshop Statistics, 3/e Solutions, Unit 1, Topic 3 1 probably more dissatisfied with the incumbent (Roosevelt) than those who did not choose to respond. e. 56% of callers who believe Elvis was alive = statistic 57% of voters who indicated they would vote for Alf Landon = statistic 63% of voters who actually voted for Franklin Roosevelt = parameter f. proportion of students in your class who use instant messaging = statistic proportion of students at your school who use instant messaging = parameter average number of hours students at your school spent watching TV = parameter average number of hours students in your class slept last night = statistic g. proportion of voters who voted for Bush in 2004 = parameter proportion of voters surveyed by CNN who voted for John Kerry = statistic proportion of voters among faculty members who voted for Nader = parameter (assume population = all of your school’s voting faculty members) average number of points scored in a Super Bowl game = parameter (population = all Super Bowl games) h. A categorical variable leads to a parameter or statistic that is a proportion; a quantitative variable leads to a parameter or statistic that is an average. Activity 3-2: Self-Injuries a. observational units = students; variable = whether or not they had injured themselves; type = binary categorical b. population = all American college students sample = the 2875 students from Cornell and Princeton who responded to the survey c. the sample size is 2875 Rossman/Chance, Workshop Statistics, 3/e Solutions, Unit 1, Topic 3 2 d. 17% is a statistic - it is a proportion derived from the sample of students. e. This percentage is unlikely to be representative of all college students in the world since the sample was taken from two U.S. colleges and the college experience in the U.S. is very different from the rest of the world. It is not even clear that it would be representative of all U.S. colleges since both schools used in the survey were Ivy League schools, so their students would hardly be ‘typical’ U.S. college students and may also have distinct types of stress and social reactions to stress. Activity 3-3: Candy and Longevity 3-3, 21-27 a. No – this is unlikely to be a representative sample of the health habits of all adult Americans. Everyone in the sample was male and college educated (to some extent) at an Ivy League school at least 30 years before the study. This is not the picture of the “average” American. In addition to the gender differences, the health knowledge and access to medical care by the men in this sample could differ from the rest of the population. b. proportion who consumed candy = 4529/7841 = .5776; This is a statistic. c. proportion of nonconsumers that had died =247/3312 = .075; proportion of consumers that had died = 267/4529 = .059 d. observational units = 7841 men who entered Harvard between 1916 and 1950 explanatory variable = whether or not they consumed candy type = binary categorical response variable = whether or not they had died by the end of 1993 type = binary categorical Rossman/Chance, Workshop Statistics, 3/e Solutions, Unit 1, Topic 3 3 e. Perhaps men who like candy also like to exercise regularly while those who do not tend eat candy perhaps do not like to exercise. In this case, it might be the exercise that increases lifespan, rather than the candy. (other possibilities include differences in diet, differences in family size, happiness levels) f. proportion of nonconsumers who had never smoked = 1201/3312 = .363; proportion of consumers who had never smoked =1852/4529 = .409 g. A greater percentage of the candy consumers had never smoked. The higher death rate among those who did not tend to consume candy might have been due to smoking rather than not eating candy. Activity 3-4: Sporting Examples 2-6, 3-4, 8-14, 10-11, 22-26 a. observational units = statistics students explanatory variable = section (exclusively sports examples or not) type = binary categorical response variable = performance (points earned) type = quantitative b. We know this is an observational study because the students self-selected into the two sections. The researcher (professor) merely passively observed the students’ selections and subsequent performances. c. No – it is not legitimate to conclude that the sports examples caused the lower academic performance. One obvious confounding variable would be the time of the class. The section with exclusively sports examples was offered at an earlier hour of the morning than the other section. Perhaps students were not as awake for this section, or perhaps attendance was worse Rossman/Chance, Workshop Statistics, 3/e Solutions, Unit 1, Topic 3 4 for this section because of the earlier hour. Either of these could be part of the reason for the lower academic performance in this section. Activity 3-5: Childhood Obesity and Sleep [insert checkmark icon] a. The explanatory variable is the amount of sleep that a child gets per night. This is a quantitative variable, although it would be categorical if the sleep information was reported only in intervals (more sleep vs. less sleep). The response variable is whether the child is obese, which is a binary categorical variable. b. This is an observational study because the researchers passively recorded information about the children’s sleeping habits. They did not impose a certain amount of sleep on children. Therefore, it is not appropriate to draw a cause-and-effect conclusion that less sleep causes a higher rate of obesity. Children who get less sleep might differ in some other way that could account for the increased rate of obesity. For example, amount of exercise could be a confounding variable. Perhaps children who exercise less have more trouble sleeping, in which case exercise would be confounded with sleep. You have no way of knowing whether the higher rate of obesity is due to less sleep or less exercise, or both, or some other variable that is also related to both sleep and obesity. c. The population from which these children were selected is apparently all children aged 5–10 in primary schools in the city of Trois-Rivieres. These Quebec children might not be representative of all children in this age group worldwide, so you should be cautious about generalizing that a relationship between sleep and obesity exists for children around the world. Rossman/Chance, Workshop Statistics, 3/e Solutions, Unit 1, Topic 3 5 Homework Activities Activity 3-6: Elvis Presley and Alf Landon 3-1, 3-6, 16-5 a. This is a very biased sampling method. We would expect this method to overestimate the proportion of adults who believe the Elvis faked his death since people who feel strongly about this are likely to be the ones responding to such an internet poll. b. This is a statistic. c. While this number may feel large to you, we really have no way of knowing, based on the statistic alone, whether a sampling method is biased. It is better to consider the sampling method when accessing whether you believe bias is present. d. The sample size is 2032. Taking a larger sample would not reduce the bias – if the method is bad, increasing the sample size will not correct the problem. Activity 3-7: Student Data 1-1, 1-5, 2-7, 2-8, 3-7, 7-8 a. Answers will vary by school and class. b. Answers will vary by school and class. c. Answers will vary by school and class. Activity 3-8: Generation M 3-8, 4-14, 13-6, 16-1, 16-3, 16-7, 18-1, 21-11, 21-12 a. parameter b. statistic c. statistic Rossman/Chance, Workshop Statistics, 3/e Solutions, Unit 1, Topic 3 6 d. statistic e. parameter f. statistic g. parameter h. statistic Activity 3-9: Community Ages a. parameter – You would be viewing your community as the population. b. Yes – this would be biased. It would probably overestimate the average age of residents as younger residents do not attend church as frequently as older residents. . c. Yes – this would be a biased sampling method. This would underestimate the average age of residents as most drivers at the daycare facility tend to be young adults, not middle-aged or elderly. This method would also exclude all residents who are not yet old enough to drive. Activity 3-10: Penny Thoughts 2-1, 3-10, 16-23 a. 2136 is the sample size, not the population. The population is all American adults. b. The sample is the 2136 people contacted by the Harris Poll; 59% is a statistic. c. The variable is an unknown proportion of the population who favor abolishing the penny. d. The observational units are people, not pennies. e. The parameter is a number (of unknown value). The population is all American adults. f. The statistic is a percentage of the sample of 2136 people who favor abolishing the penny, 59% – not an average. Rossman/Chance, Workshop Statistics, 3/e Solutions, Unit 1, Topic 3 7 Activity 3-11: Class Engagement a. No – this is an observational study and there are at least two potential confounding variables that could explain the higher level of engagement in the statistics class. So you cannot attribute the difference to the subject matter. b. 1) the time of the class (8:00 AM or 11 AM) 2) the instructor (Newton or Fisher) Activity 3-12: Web Addiction a. population = all visitors to the abcnews.com website (or internet users) sample = 17,251 users of abcnews.com who responded to the survey b. The proportion of the population who have some sort of addiction to the internet. c. The 6% is probably not a reasonable estimate of the parameter since the survey was voluntary. Those who use the internet more and are more addicted to it are more likely to respond to an online survey. This would make the 6% higher than the percentage for all visitors to the site or for all internet users in general. Alternatively, you could argue that many addicts might not be willing to admit to a “problem” and the 6% is lower than the true proportion in the population though this is more of a nonsampling error (people lying) rather than a sample selection issue. See Topic 4 (Activity 4-20 in particular) for more discussion of nonsampling errors. Activity 3-13: Alternative Medicine This sample result is probably not representative of the truth concerning the population of all adult Americans because the sampling method is biased. Only readers of Self magazine were part of the poll, and the readers of this health magazine were probably the type of people who try Rossman/Chance, Workshop Statistics, 3/e Solutions, Unit 1, Topic 3 8 alternative medicines more than non-readers (bad sampling frame). Furthermore, strong advocates of alternative medicines would probably be more likely to reply to a mail-in poll (voluntary response bias). Therefore, this result is very likely to be an overestimate of the proportion of all adult Americans who have used alternative medicines. Activity 3-14: Courtroom Cameras a. 800/812 = .985; statistic b. This sample probably does not represent well the population of all adult Americans. Only those people familiar with the trial and with the fact that they could write letters to the Judge about their opinions and who felt very strongly about the issue would take the time to write. Those who didn’t mind the use of cameras probably wouldn’t feel the need to write in. This was a voluntary sample and not random at all. Activity 3-15: Junior Golfer Survey a. No – this is not a representative sample of all American teenagers because most teenagers do not play golf. b. Yes – this sampling procedure is likely to be biased with respect to voting preference. Golfing is an expensive sport, and the wealthy tend to vote Republican, so these teenagers have probably grown-up in Republican households. c. Rossman/Chance, Workshop Statistics, 3/e Solutions, Unit 1, Topic 3 9 1 0.9 0.8 Proportion 0.7 0.6 0.5 0.4 0.3 0.2 0.1 0 Democrat Republican Neither Don't Know Voting Preference d. Yes – this sampling procedure is likely to be biased with regard to both of these variables. If Junior golfers tend to come from more affluent families, they almost certainly have a cell phone and computer in their home, making online access readily available and probably given them more free time to spend on the computer. Of course if they are more physically active and training for tournaments, they may tend to spend less time online than a typical teen. Activity 3-16: Accumulating Frequent Flyer Miles a. observational unit = visitors of msnbc.com; variable = whether or not they use a credit card to accumulate airline miles (binary categorical) b. statistic – because it is a number computed from a sample (from 1935 online responses) c. This sampling method is most likely biased (because it is voluntary) and will provide an overestimate of the proportion of all American adults who use a credit card to accumulate airline miles. People who are willing to respond to an online survey are more likely to be comfortable to use their credit card over the internet and to take advantage of internet offers. Rossman/Chance, Workshop Statistics, 3/e Solutions, Unit 1, Topic 3 10 d. The sample size is 1935. No – it does not affect the answer to part c. This is a large sample size, and even if it weren’t, a large sample size will not compensate for bias caused by a poor sampling method. Activity 3-17: Foreign Language Study 3-17, 5-11 a. Yes – these are observational studies. Researchers could only have passively observed the association between foreign language study and verbal SAT scores rather than determining for students whether or not they took a foreign language in high school. b. No – it is not legitimate to conclude that foreign language study causes an improvement in students’ verbal abilities. We can never draw cause-and-effect conclusions between variables from an observational study. One possible confounding variable is verbal aptitude. Perhaps students with strong verbal aptitudes choose to enroll in foreign language courses and also perform well on the verbal portion of the SAT exam. Students with weaker verbal skills may avoid foreign language courses and may also perform less well on the verbal portion of the SAT. Activity 3-18: Smoking and Lung Cancer 3-18, 3-19 The student needs to explain how diet could be connected to both the explanatory (smoking) and response (lung cancer) variables. How could diet explain the apparent strong connection between smoking and lung cancer? For example, smokers may also tend to have poorer overall diets and it is the poor diet that leads to higher rates of cancer. Activity 3-19: Smoking and Lung Cancer 3-18, 3-19 Rossman/Chance, Workshop Statistics, 3/e Solutions, Unit 1, Topic 3 11 a. explanatory = smoking habits; response = whether or not they died of lung cancer b. Yes – this is an observational study. The researchers passively observed the smoking habits and life spans of their subjects rather than actively imposing the smoking habits of the individuals. c. Yes – we should have qualms about generalizing these results to a larger population. The subjects were all males and were haphazardly selected by volunteers so the results definitely should not be extended to women and may also be unrepresentative of the general population as well depending on how the volunteers selected the individuals. Activity 3-20: A Nurse Accused 1-6, 3-20, 6-10, 25-23 a. observational units = eight hours shifts; explanatory variable = whether or not Gilbert worked on the shift; response variable = whether or not a patient died on the shift b. Yes, this is an observational study since the researchers did not randomly determine which shifts Gilbert would work c. No – because this is an observational study we cannot draw any cause-and-effect conclusions between the variables. d. Perhaps Gilbert is a senior-level intensive care nurse whose patients are generally in more critical condition than seen by nurses on other shifts. If she works primarily with patients who are less likely to survive then it would not be surprising that the death rate on her shift is higher than that of the hospital average. Or, perhaps Gilbert works night or weekend shifts which tend to have higher death rates than day-time or weekday shifts. Activity 3-21: Buckle Up! Rossman/Chance, Workshop Statistics, 3/e Solutions, Unit 1, Topic 3 12 2-4, 3-21, 8-5 a. Yes – this is an observational study. We know because we collected existing data about the states. b. No – we cannot conclude that the tougher seatbelt laws cause a higher proportion of residents to comply because this is an observational study. c. Yes – the data suggest that tougher seatbelt laws may result in lower death rates because the tougher seatbelt laws are associated with higher seatbelt compliance. Activity 3-22: Yoga and Middle-Aged Weight Gain a. explanatory = whether or not middle-aged adults practiced yoga (binary categorical) response = amount of weight gained/lost between the ages of 45 and 55 (quantitative) b. Yes this is an observational study because the researchers passively collected the data through surveys rather than randomly determining who would practice yoga. c. No, this study does not allow us to draw a cause-and-effect conclusion between practicing yoga and gaining less weight because it is an observational study and we can never draw such conclusions based on observational studies. d. A potential confounding variable is the amount of weekly exercise obtained by each adult. Perhaps adults who practice yoga also tend to engage in other forms of exercise on a regular basis, and this is what caused their weight loss. Adults who showed more weight gain may have participated in less overall exercise during the years from 45-55. Activity 3-23: Pet Therapy 3-23, 5-13 Rossman/Chance, Workshop Statistics, 3/e Solutions, Unit 1, Topic 3 13 a. Yes – this is an observational study because you are passively observing and recording information about the patients instead of randomly determining which individuals would own a pet. b. explanatory = whether or not a recovering heart attack patient has a pet (binary categorical) response = whether or not the patient survives for 5 years (binary categorical) c. No – you cannot conclude that pet ownership leads to therapeutic benefits for heart attack patients based on this study, because it is an observational study and we can never conclude cause-and-effect from an observational study. There are many potential confounding variables that could explain the association. Activity 3-24: Winter Heart Attacks a. A possible confounding variable could be weather. An alternative explanation could be that during the months of December and January, the weather is colder, the days are shorter, people tend to get less exercise (or more straining exercise such as shoveling snow) and these factors in turn increases the number of heart attacks. b. This reduces the viability of the change in weather explanation. c. A remaining confounding variable might be the length of the days. As the days shorten in the winter (and less sunlight is available), people become depressed and this may increase the number of heart attacks that occur. Activity 3-25: Pursuit of Happiness 2-16, 3-25, 13-17, 25-1, 25-2, 25-4 Rossman/Chance, Workshop Statistics, 3/e Solutions, Unit 1, Topic 3 14 No – these study results do not establish a causal connection between income and happiness because this is an observational study and we can never conclude cause-and-effect from an observational study. There are many potential confounding variables that could explain the association. Activity 3-26: Televisions, Computers, and Achievement a. explanatory = whether or not there was a television in the bedroom (binary categorical) whether or not there was a computer in the home (binary categorical) response = score on mathematics portion of the achievement test (quantitative) score on language arts portion of the achievement test (quantitative) b. Yes – this is an observational study. The researchers passively observed/collected the achievement scores and television/computer information about these children and did not impose any treatments. c. No – you cannot make either conclusion because this is an observational study. d. There are many possible answers here. One confounding variable might be the financial status of the family. Families that are better-off financially are more likely to have computers, but are also more likely to expose their children to various forms of literature and language arts, such as books, magazines and theatre, etc. This exposure, rather than the home computer, could be responsible for the higher scores on the language arts portion of the test. e. The sample is the 348 Chicago 3rd graders. f. If we assume the sample was randomly selected then we could generalize to all 3rd graders in the Chicago area. As they may not be typical of all 3rd graders anywhere else, we probably would not want to generalize beyond this population. Rossman/Chance, Workshop Statistics, 3/e Solutions, Unit 1, Topic 3 15 Activity 3-27: Parking Meter Reliability If the meters were randomly selected from Berkeley, we might be willing to generalize to Berkeley. However, since they were not randomly selected from all California parking meters, we wouldn’t be willing to generalize the results to this population. Activity 3-28: Night Lights and Nearsightedness a. No – assuming that these are observational studies, there are potential confounding variables that prevent us from legitimately concluding that sleeping with a night light causes a higher rate of nearsightedness. b. This argument is incomplete because the student has not explained how “genetics” is connected to sleeping with a nightlight (the explanatory variable) as well as to the rate of nearsightedness (the response variable). The student should have said: Genetics, because nearsighted parents tend to have nearsighted children and it could be that parents who are themselves nearsighted (genetics) are more likely to provide a nightlight for their children. Rossman/Chance, Workshop Statistics, 3/e Solutions, Unit 1, Topic 3 16

