5.2.b. Method_used_for_estimation_of_standard_error
advertisement

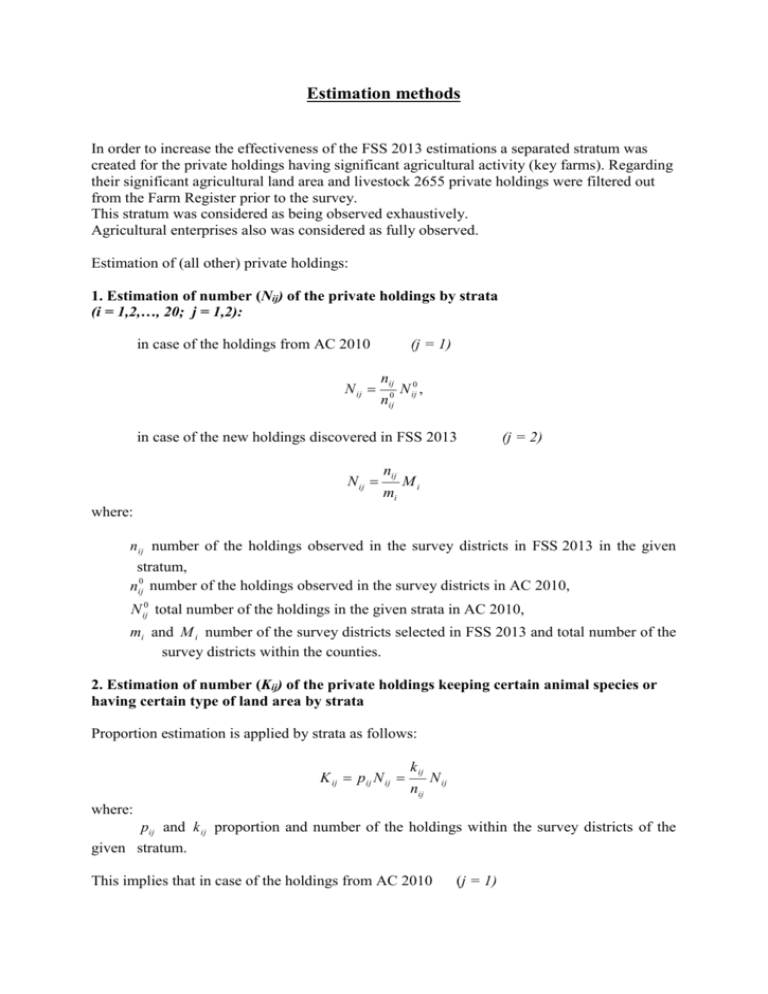
Estimation methods In order to increase the effectiveness of the FSS 2013 estimations a separated stratum was created for the private holdings having significant agricultural activity (key farms). Regarding their significant agricultural land area and livestock 2655 private holdings were filtered out from the Farm Register prior to the survey. This stratum was considered as being observed exhaustively. Agricultural enterprises also was considered as fully observed. Estimation of (all other) private holdings: 1. Estimation of number (Nij) of the private holdings by strata (i = 1,2,…, 20; j = 1,2): in case of the holdings from AC 2010 N ij (j = 1) nij n 0 ij N ij0 , in case of the new holdings discovered in FSS 2013 N ij nij mi (j = 2) Mi where: n ij number of the holdings observed in the survey districts in FSS 2013 in the given stratum, nij0 number of the holdings observed in the survey districts in AC 2010, N ij0 total number of the holdings in the given strata in AC 2010, mi and M i number of the survey districts selected in FSS 2013 and total number of the survey districts within the counties. 2. Estimation of number (Kij) of the private holdings keeping certain animal species or having certain type of land area by strata Proportion estimation is applied by strata as follows: K ij pij N ij k ij nij N ij where: pij and k ij proportion and number of the holdings within the survey districts of the given stratum. This implies that in case of the holdings from AC 2010 (j = 1) K ij kij nij nij nij0 N ij0 N 0 ij nij0 k ij , in case of the new holdings discovered in FSS 2013 K ij k ij nij nij mi Mi (j = 2) Mi k ij . mi 3. Estimated total of the rest characteristics (Xij) by strata Estimation of the mean or ratio estimation is applied by strata as follows: X ij xij nij N ij X ij hij X ij0 xij xij0 X ij0 where: x ij total of the holdings observed in survey districts in FSS 2013 by strata, xij0 and X ij0 total of the sample and the whole population in AC 2010 hij the ratio of x ij and xij0 . This implies that in case of the holdings from AC 2010 X ij xij nij nij nij0 (j = 1) N 0 ij N ij0 nij0 xij , in case of the new holdings discovered in FSS 2013 X ij xij nij nij mi Mi Mi xij . mi (j = 2) Sample errors 1. Since the number (Nij) of the holdings by strata is estimated, it also has a sampling error. The square of the standard errors is calculated as follows: in case of holdings from AC 2010 N2 (j = 1) 2 nij Li nijl 0 nijl0 , nij l 1 mi ij in case of the new holdings discovered in FSS 2013 2 N ij mi 2 nij2 Li nijl l 1 mi (j = 2) where: Li M i ( M i mi ) , and mi (mi 1) nijl number of the holdings observed in survey district ‘l” in FSS 2013, nijl0 number of the holdings observed in survey district ‘l” in AC 2010. 2. The square of the standard errors relating to the number (Kij) of the private holdings keeping certain animal species or having certain type of land area, by strata are calculated as follows: 2 K ij k ij Li K k ijl nijl nij l 1 2 ij mi 2 where: k ijl number of the appropriate holdings within the survey district “l” in the given stratum. 3. The square of the standard errors relating to the estimated total (Xij) of the rest characteristics by strata is calculated as follows: in case of the mean estimation, 2 X ij 2 xij Li xijl nijl , nij l 1 mi where: xijl total of the holdings observed in survey district “l” in FSS 2013 in the given stratum, To calculate the square of the standard errors relating to unions of strata (i = 1,2,…, 7; j = 1,2) squares of the standard error relating to the various strata are summed up. As usual, the coefficient of variation (CV) is computed by dividing the standard error with the appropriate number of holdings or totals. The calculation of sampling error (before the survey) The calculation of regular sampling error is possible after fulfill survey. Till then, we can only estimate the errors by criteria on national and county level. Therefore to the calculations we took the sample from the entirely Agriculture Census according to the described method. In the calculations ni is the number of individual farms in the i. county in the sample, Ni is the number of individual farms in the i. county, according to the Agricultural Census, y ij (n) is the total number of j. criterion (horses, asses, mules, etc) in the i. county in the samples. N We applied the sum of the values estimate: Yˆij i ni y ij (n) in i. county, for j. criterion (horses, asses, mules, etc.). In case of happenstance standard error of the average of sample in i county for j. attributes: j yi ˆ j yi ni (y ij y ji ) 2 n i 1 1 ni Where y ji in the i. county the j. criterion is calculated according to the sample average. The standard error of the sum of sample in i. county for j. attributes: (j yi ) N i2 ( yj i ) 2 ( Ŷij Ni y ij (n) N i y ji ) ni The percentage estimate of standard error of the sum of sample in i. county for j. attributes: i j j yi Ŷ ji 100 Thus, the total relative standard error in i. county for j. attributes: ij (Ŷij ji ) 2 (Ŷij Ŷij key _ farms )2 The total relative standard error of the country level for j. attributes is the weighted errors of counties, namely: j (Ŷ ij j i )2 i (Ŷj Ŷj key _ farms )2


