SPSS Assumptions Breakdown
advertisement
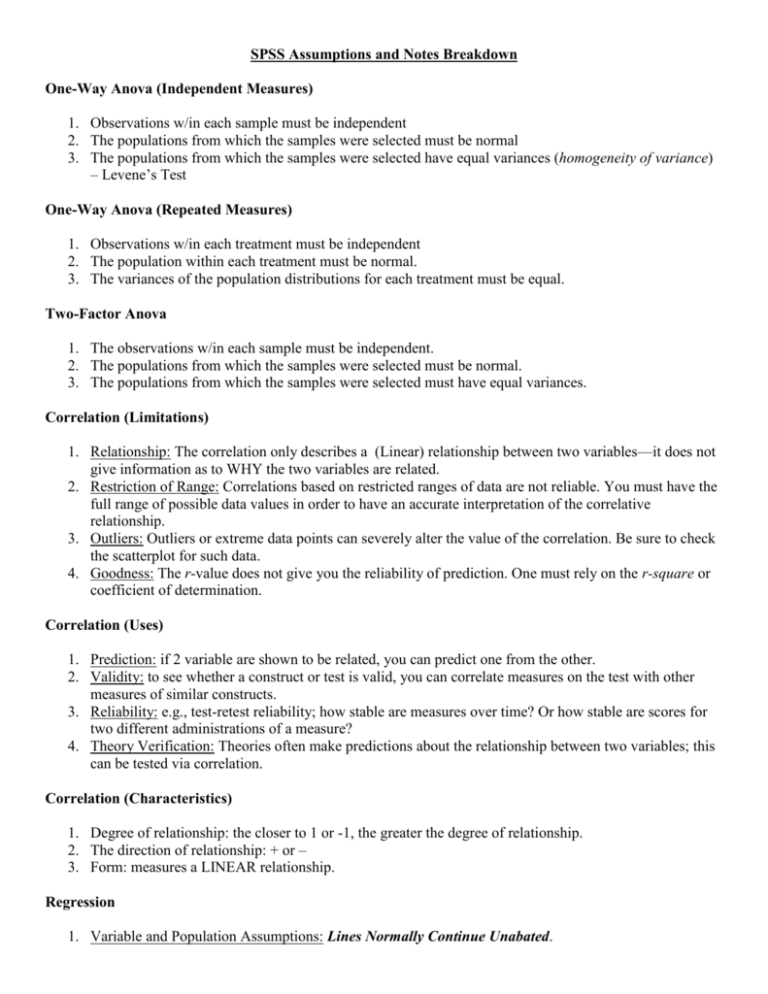
SPSS Assumptions and Notes Breakdown One-Way Anova (Independent Measures) 1. Observations w/in each sample must be independent 2. The populations from which the samples were selected must be normal 3. The populations from which the samples were selected have equal variances (homogeneity of variance) – Levene’s Test One-Way Anova (Repeated Measures) 1. Observations w/in each treatment must be independent 2. The population within each treatment must be normal. 3. The variances of the population distributions for each treatment must be equal. Two-Factor Anova 1. The observations w/in each sample must be independent. 2. The populations from which the samples were selected must be normal. 3. The populations from which the samples were selected must have equal variances. Correlation (Limitations) 1. Relationship: The correlation only describes a (Linear) relationship between two variables—it does not give information as to WHY the two variables are related. 2. Restriction of Range: Correlations based on restricted ranges of data are not reliable. You must have the full range of possible data values in order to have an accurate interpretation of the correlative relationship. 3. Outliers: Outliers or extreme data points can severely alter the value of the correlation. Be sure to check the scatterplot for such data. 4. Goodness: The r-value does not give you the reliability of prediction. One must rely on the r-square or coefficient of determination. Correlation (Uses) 1. Prediction: if 2 variable are shown to be related, you can predict one from the other. 2. Validity: to see whether a construct or test is valid, you can correlate measures on the test with other measures of similar constructs. 3. Reliability: e.g., test-retest reliability; how stable are measures over time? Or how stable are scores for two different administrations of a measure? 4. Theory Verification: Theories often make predictions about the relationship between two variables; this can be tested via correlation. Correlation (Characteristics) 1. Degree of relationship: the closer to 1 or -1, the greater the degree of relationship. 2. The direction of relationship: + or – 3. Form: measures a LINEAR relationship. Regression 1. Variable and Population Assumptions: Lines Normally Continue Unabated. a. Linear - The IV and DV have a linear relationship. b. Normal - All populations are normally distributed. c. Continuous - The DV is continuous and is measured on (at least) an interval scale. d. Uncorrelated obs. - Successive observations of the D.V. are uncorrelated. 2. Error Assumptions: Never maul voracious independence. a. Normal - The errors of the regression model are normally distributed. b. Mean - The mean of the errors is 0. c. Variance - The errors have a constant variance. d. Independence - The error terms are independent. Tests for Colinearity: 1. Variance Inflation Factor (VIF): If > 5, then the variables with largest VIF factors 2. Tolerance: Values closest to 1 are best, 0 means that variables are linear combinations of eachother. Interpretation of betas and BETAS 1. b is the amount of change expected in the DV as a result of a 1-unit change in the IV. 2. B is the amount of change occurring in the DV as a result of a 1-unit change Picking IVs 1. Pick variables that are strongly correlated with the DV. 2. Pick variables that are weakly correlated with one another (< 0.7) 3. SAMPLE SIZE MUST BE 4 X THE NUMBER OF IVs. Examining a Regression Model: 1. Is the OVERALL model significant? – Look at the ANOVA table (tests if the Betas are different than 0) 2. Are the individual variables significant – Look at the t-table and values for each IV. If IV is not significant, then throw out IV and run again. a. The standardized betas give info as to which is the best predicting variable. 3. Is the standard error too large to provide meaningful results? – compare the standard error of the estimate with the standard deviation of Y. 4. Have the regression assumptions been met? a. Population and Variables: i. Linear relationship ii. Normal populations iii. DV is continuous and measured on an interval scale (at least) iv. Successive observations of D.V. are uncorrelated. b. Errors i. Are NORMALLY distributed ii. MEAN of 0 iii. VARIANCE is constant iv. Error terms are INDEPENDENT

