PPT - ACoP
advertisement
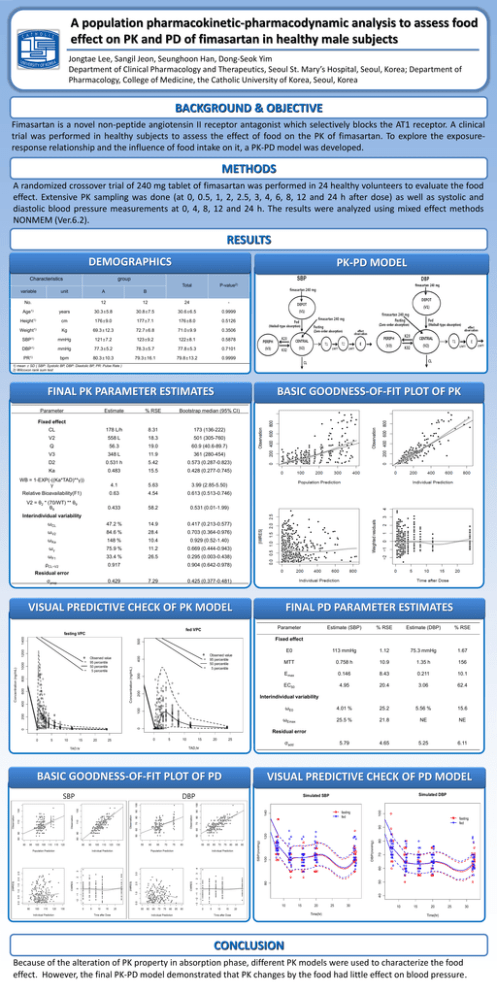
A population pharmacokinetic-pharmacodynamic analysis to assess food effect on PK and PD of fimasartan in healthy male subjects Jongtae Lee, Sangil Jeon, Seunghoon Han, Dong-Seok Yim Department of Clinical Pharmacology and Therapeutics, Seoul St. Mary’s Hospital, Seoul, Korea; Department of Pharmacology, College of Medicine, the Catholic University of Korea, Seoul, Korea BACKGROUND & OBJECTIVE Fimasartan is a novel non-peptide angiotensin II receptor antagonist which selectively blocks the AT1 receptor. A clinical trial was performed in healthy subjects to assess the effect of food on the PK of fimasartan. To explore the exposureresponse relationship and the influence of food intake on it, a PK-PD model was developed. METHODS A randomized crossover trial of 240 mg tablet of fimasartan was performed in 24 healthy volunteers to evaluate the food effect. Extensive PK sampling was done (at 0, 0.5, 1, 2, 2.5, 3, 4, 6, 8, 12 and 24 h after dose) as well as systolic and diastolic blood pressure measurements at 0, 4, 8, 12 and 24 h. The results were analyzed using mixed effect methods NONMEM (Ver.6.2). RESULTS DEMOGRAPHICS Characteristics variable PK-PD MODEL group unit No. Total P-value2) A B 12 12 24 - Age1) years 30.3±5.8 30.8±7.5 30.6±6.5 0.9999 Height1) cm 176±9.0 177±7.1 176±8.0 0.5126 Weight1) Kg 69.3±12.3 72.7±6.8 71.0±9.9 0.3506 SBP1) mmHg 121±7.2 123±9.2 122±8.1 0.5878 DBP1) mmHg 77.3±5.2 78.3±5.7 77.8±5.3 0.7101 PR1) bpm 80.3±10.3 79.3±16.1 79.8±13.2 0.9999 1) mean ± SD ( SBP: Systolic BP, DBP: Diastolic BP, PR: Pulse Rate ) 2) Wilcoxon rank sum test BASIC GOODNESS-OF-FIT PLOT OF PK FINAL PK PARAMETER ESTIMATES Parameter Estimate % RSE Bootstrap median (95% CI) CL 178 L/h 8.31 173 (136-222) V2 558 L 18.3 501 (305-760) Q 56.3 19.0 60.9 (40.6-89.7) V3 348 L 11.9 361 (280-454) D2 0.531 h 5.42 0.573 (0.287-0.823) Ka 0.483 15.5 0.428 (0.277-0.745) WB = 1-EXP(-((Ka*TAD)**γ)) γ 4.1 5.63 3.99 (2.85-5.50) Relative Bioavailability(F1) 0.63 4.54 0.613 (0.513-0.746) V2 = θ2 * (70/WT) ** θ9 θ9 0.433 58.2 0.531 (0.01-1.99) ωCL 47.2 % 14.9 0.417 (0.213-0.577) ωV2 84.6 % 28.4 0.703 (0.364-0.976) ωKa 148 % 10.4 0.929 (0.52-1.40) ωγ 75.9 % 11.2 0.669 (0.444-0.943) ωF1 33.4 % 26.5 0.295 (0.003-0.438) ρCL~V2 0.917 Fixed effect Interindividual variability 0.904 (0.642-0.978) Residual error 0.429 7.29 0.425 (0.377-0.481) VISUAL PREDICTIVE CHECK OF PK MODEL Parameter fed VPC % RSE Estimate (DBP) % RSE E0 113 mmHg 1.12 75.3 mmHg 1.67 MTT 0.758 h 10.9 1.35 h 156 Emax 0.146 8.43 0.211 10.1 EC50 4.95 20.4 3.06 62.4 ωE0 4.01 % 25.2 5.56 % 15.6 ωEmax 25.5 % 21.8 NE NE 5.79 4.65 5.25 6.11 200 300 400 Observed value 95 percentile 50 percentile 5 percentile Interindividual variability 0 0 200 100 Concentration (ng/mL) 1200 400 600 800 1000 Observed value 95 percentile 50 percentile 5 percentile Estimate (SBP) Fixed effect 500 1400 fasting VPC Concentration (ng/mL) FINAL PD PARAMETER ESTIMATES 0 5 10 15 TAD,hr 20 25 Residual error 0 5 10 15 20 25 σadd TAD,hr BASIC GOODNESS-OF-FIT PLOT OF PD DBP Simulated DBP Simulated SBP 140 SBP VISUAL PREDICTIVE CHECK OF PD MODEL 100 σprop fasting fed 80 40 80 50 60 70 DBP(mmHg) 100 SBP(mmHg) 120 90 fasting fed 10 15 20 Time(hr) 25 30 10 15 20 25 30 Time(hr) CONCLUSION Because of the alteration of PK property in absorption phase, different PK models were used to characterize the food effect. However, the final PK-PD model demonstrated that PK changes by the food had little effect on blood pressure.
