Screening analysis for drugs dangerous to road safety in whole
advertisement
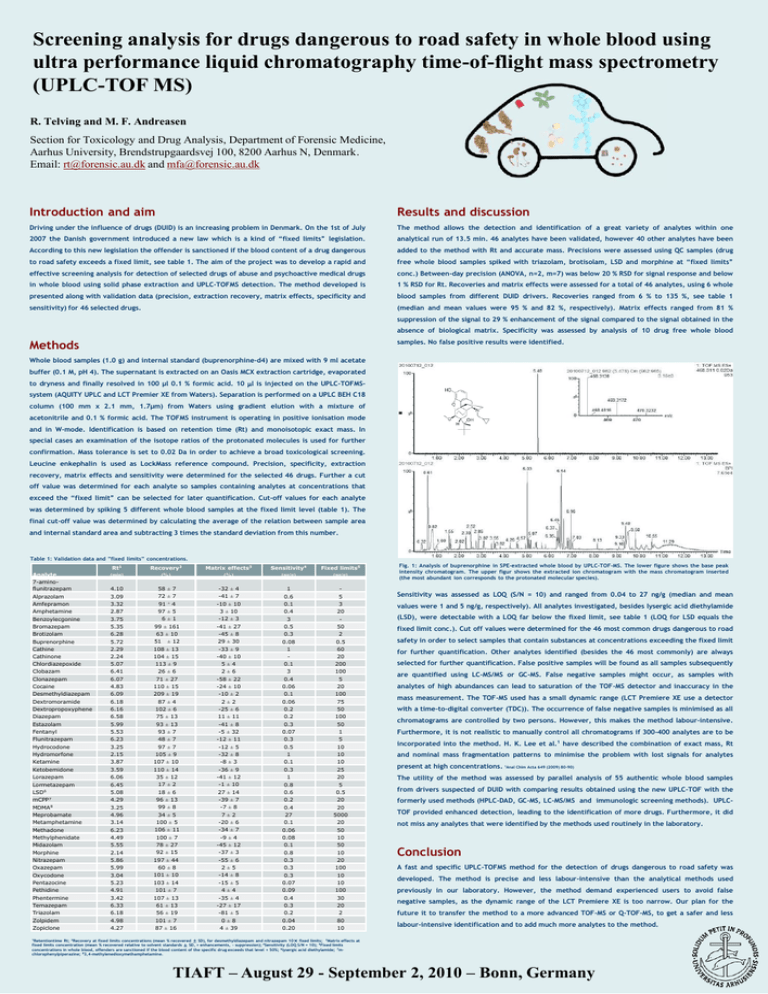
Screening analysis for drugs dangerous to road safety in whole blood using ultra performance liquid chromatography time-of-flight mass spectrometry (UPLC-TOF MS) R. Telving and M. F. Andreasen Section for Toxicology and Drug Analysis, Department of Forensic Medicine, Aarhus University, Brendstrupgaardsvej 100, 8200 Aarhus N, Denmark. Email: rt@forensic.au.dk and mfa@forensic.au.dk Introduction and aim Results and discussion Driving under the influence of drugs (DUID) is an increasing problem in Denmark. On the 1st of July The method allows the detection and identification of a great variety of analytes within one 2007 the Danish government introduced a new law which is a kind of “fixed limits” legislation. analytical run of 13.5 min. 46 analytes have been validated, however 40 other analytes have been According to this new legislation the offender is sanctioned if the blood content of a drug dangerous added to the method with Rt and accurate mass. Precisions were assessed using QC samples (drug to road safety exceeds a fixed limit, see table 1. The aim of the project was to develop a rapid and free whole blood samples spiked with triazolam, brotisolam, LSD and morphine at “fixed limits” effective screening analysis for detection of selected drugs of abuse and psychoactive medical drugs conc.) Between-day precision (ANOVA, n=2, m=7) was below 20 % RSD for signal response and below in whole blood using solid phase extraction and UPLC-TOFMS detection. The method developed is 1 % RSD for Rt. Recoveries and matrix effects were assessed for a total of 46 analytes, using 6 whole presented along with validation data (precision, extraction recovery, matrix effects, specificity and blood samples from different DUID drivers. Recoveries ranged from 6 % to 135 %, see table 1 sensitivity) for 46 selected drugs. (median and mean values were 95 % and 82 %, respectively). Matrix effects ranged from 81 % suppression of the signal to 29 % enhancement of the signal compared to the signal obtained in the absence of biological matrix. Specificity was assessed by analysis of 10 drug free whole blood Methods samples. No false positive results were identified. Whole blood samples (1.0 g) and internal standard (buprenorphine-d4) are mixed with 9 ml acetate buffer (0.1 M, pH 4). The supernatant is extracted on an Oasis MCX extraction cartridge, evaporated to dryness and finally resolved in 100 µl 0.1 % formic acid. 10 l is injected on the UPLC-TOFMSsystem (AQUITY UPLC and LCT Premier XE from Waters). Separation is performed on a UPLC BEH C18 column (100 mm x 2.1 mm, 1.7µm) from Waters using gradient elution with a mixture of acetonitrile and 0.1 % formic acid. The TOFMS instrument is operating in positive ionisation mode and in W-mode. Identification is based on retention time (Rt) and monoisotopic exact mass. In special cases an examination of the isotope ratios of the protonated molecules is used for further confirmation. Mass tolerance is set to 0.02 Da in order to achieve a broad toxicological screening. Leucine enkephalin is used as LockMass reference compound. Precision, specificity, extraction recovery, matrix effects and sensitivity were determined for the selected 46 drugs. Further a cut off value was determined for each analyte so samples containing analytes at concentrations that exceed the “fixed limit” can be selected for later quantification. Cut-off values for each analyte was determined by spiking 5 different whole blood samples at the fixed limit level (table 1). The final cut-off value was determined by calculating the average of the relation between sample area and internal standard area and subtracting 3 times the standard deviation from this number. Table 1: Validation data and ”fixed limits” concentrations. Analyte 7-aminoflunitrazepam Alprazolam Amfepramon Amphetamine Benzoylecgonine Bromazepam Brotizolam Buprenorphine Cathine Cathinone Chlordiazepoxide Clobazam Clonazepam Cocaine Desmethyldiazepam Dextromoramide Dextropropoxyphene Diazepam Estazolam Fentanyl Flunitrazepam Hydrocodone Hydromorfone Ketamine Ketobemidone Lorazepam Lormetazepam LSD6 mCPP7 MDMA8 Meprobamate Metamphetamine Methadone Methylphenidate Midazolam Morphine Nitrazepam Oxazepam Oxycodone Pentazocine Pethidine Phentermine Temazepam Triazolam Zolpidem Zopiclone Rt1 (min) Recovery2 (%) Matrix effects3 (%) Sensitivity4 (ng/g) Fixed limits5 (ng/g) 4.10 3.09 3.32 2.87 3.75 5.35 6.28 5.72 2.29 2.24 5.07 6.41 6.07 4.83 6.09 6.18 6.16 6.58 5.99 5.53 6.23 3.25 2.15 3.87 3.59 6.06 6.45 5.08 4.29 3.25 4.96 3.14 6.23 4.49 5.55 2.14 5.86 5.99 3.04 5.23 4.91 3.42 6.33 6.18 4.98 4.27 58 ± 7 72 ± 7 -32 ± 4 -41 ± 7 -10 ± 10 3 ± 10 -12 ± 3 -41 ± 27 -45 ± 8 29 ± 30 -33 ± 9 -40 ± 10 5±4 2±6 -58 ± 22 -24 ± 10 -10 ± 2 2±2 -25 ± 6 11 ± 11 -41 ± 8 -5 ± 32 -12 ± 11 -12 ± 5 -32 ± 8 -8 ± 3 -36 ± 9 -41 ± 12 -1 ± 10 27 ± 14 -39 ± 7 -7 ± 8 7±2 -20 ± 6 -34 ± 7 -9 ± 4 -45 ± 12 -37 ± 3 -55 ± 6 2±5 -14 ± 8 -15 ± 5 4±4 -35 ± 4 -27 ± 17 -81 ± 5 0±8 4 ± 39 1 0.6 0.1 0.4 3 0.5 0.3 0.08 1 0.1 3 0.4 0.06 0.1 0.06 0.2 0.2 0.3 0.07 0.3 0.5 1 0.1 0.3 1 0.8 0.6 0.2 0.4 27 0.1 0.06 0.08 0.1 0.8 0.3 0.3 0.3 0.07 0.09 0.4 0.3 0.2 0.04 0.20 5 3 20 50 2 0.5 60 20 200 100 5 20 100 75 50 100 50 1 5 10 10 10 25 20 5 0.5 20 20 5000 20 50 10 50 10 20 100 10 10 100 30 20 2 80 10 91 ± 4 97 ± 5 6±1 99 ± 161 63 ± 10 51 ± 12 108 ± 13 104 ± 15 113 ± 9 26 ± 6 71 ± 27 110 ± 15 209 ± 19 87 ± 4 102 ± 6 75 ± 13 93 ± 13 93 ± 7 48 ± 7 97 ± 7 105 ± 9 107 ± 10 110 ± 14 35 ± 12 17 ± 2 18 ± 6 96 ± 13 99 ± 8 34 ± 5 100 ± 5 106 ± 11 100 ± 7 78 ± 27 92 ± 15 197 ± 44 60 ± 8 101 ± 10 103 ± 14 101 ± 7 107 ± 13 61 ± 13 56 ± 19 101 ± 7 87 ± 16 Fig. 1: Analysis of buprenorphine in SPE-extracted whole blood by UPLC-TOF-MS. The lower figure shows the base peak intensity chromatogram. The upper figur shows the extracted ion chromatogram with the mass chromatogram inserted (the most abundant ion corresponds to the protonated molecular species). Sensitivity was assessed as LOQ (S/N = 10) and ranged from 0.04 to 27 ng/g (median and mean values were 1 and 5 ng/g, respectively). All analytes investigated, besides lysergic acid diethylamide (LSD), were detectable with a LOQ far below the fixed limit, see table 1 (LOQ for LSD equals the fixed limit conc.). Cut off values were determined for the 46 most common drugs dangerous to road safety in order to select samples that contain substances at concentrations exceeding the fixed limit for further quantification. Other analytes identified (besides the 46 most commonly) are always selected for further quantification. False positive samples will be found as all samples subsequently are quantified using LC-MS/MS or GC-MS. False negative samples might occur, as samples with analytes of high abundances can lead to saturation of the TOF-MS detector and inaccuracy in the mass measurement. The TOF-MS used has a small dynamic range (LCT Premiere XE use a detector with a time-to-digital converter (TDC)). The occurrence of false negative samples is minimised as all chromatograms are controlled by two persons. However, this makes the method labour-intensive. Furthermore, it is not realistic to manually control all chromatograms if 300-400 analytes are to be incorporated into the method. H. K. Lee et al.1 have described the combination of exact mass, Rt and nominal mass fragmentation patterns to minimise the problem with lost signals for analytes present at high concentrations. 1Anal Chim Acta 649 (2009) 80-90) The utility of the method was assessed by parallel analysis of 55 authentic whole blood samples from drivers suspected of DUID with comparing results obtained using the new UPLC-TOF with the formerly used methods (HPLC-DAD, GC-MS, LC-MS/MS and immunologic screening methods). UPLCTOF provided enhanced detection, leading to the identification of more drugs. Furthermore, it did not miss any analytes that were identified by the methods used routinely in the laboratory. Conclusion A fast and specific UPLC-TOFMS method for the detection of drugs dangerous to road safety was developed. The method is precise and less labour-intensive than the analytical methods used previously in our laboratory. However, the method demand experienced users to avoid false negative samples, as the dynamic range of the LCT Premiere XE is too narrow. Our plan for the future it to transfer the method to a more advanced TOF-MS or Q-TOF-MS, to get a safer and less labour-intensive identification and to add much more analytes to the method. 1Retentiontime Rt; 2Recovery at fixed limits concentrations (mean % recovered ± SD), for desmethyldiazepam and nitrazepam 10× fixed limits; 3Matrix effects at fixed limits concentration (mean % recovered relative to solvent standards ± SD, + enhancements, - suppression); 4Sensitivity (LOQ S/N = 10); 5Fixed limits concentrations in whole blood, offenders are sanctioned if the blood content of the specific drug exceeds that level + 50%; 6lysergic acid diethylamide; 7mchlorophenylpiperazine; 83,4-methylenedioxymethamphetamine. TIAFT – August 29 - September 2, 2010 – Bonn, Germany
