Fig. 1 - Membrane Protein Structural Dynamics Gateway
advertisement
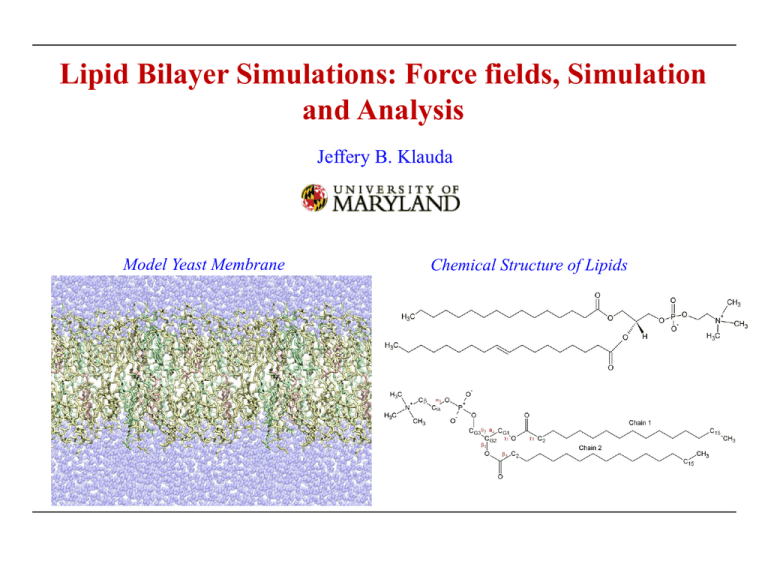
Lipid Bilayer Simulations: Force fields, Simulation and Analysis Jeffery B. Klauda Model Yeast Membrane Chemical Structure of Lipids Lipids Complex biomolecules • Contain a fatty acid chains and head group Classified into 8 categories1 Modified (Fig. 1)1 1Fahy Fatty acyls Glycerolipids Glycerolphospholipids Sphingolipids Sterol Lipids Phenol lipids Saccharolipids Polyketides et al. J. Lipid. Res. 46: 839 (2005). Glycerophospholipids Some Common Subclasses of GP lipids1 Phosphocholines Phosphonocholines Phosphoethanolamines Phosphonoethanolamines Phosphoserines Phosphoglycerols Phosphoglycerophosphates Phosphoinsitols (Modified Fig. 4)1 Phosphoinsitolmonophosphates 1Fahy et al. J. Lipid. Res. 46: 839 (2005). Phosphates Membranes in Single Cell Organisms Periplasm Cytoplasmic Membrane Channel Proteins Lipid/Cholesterol Bilayer Membrane Proteins Cytoplasm E. coli • Plasma membrane1 contains many constituents • Membranes are located throughout the cell interior Cell Membranes2 1Fig. 2Fig. 1b from Engelman, D.M. Nature. 438: 578 (2005). 1a from McMahon, H.T. et al. Nature. 438: 590 (2005). Diversity of Lipid Types in Organisms Yeast (Saccharomyces cerevisiae)1 • Mixture of fully saturated and unsaturated chains • Mixture of charged and zwitterionic head groups and typically 10-20% sterols • Compositions depend on strain of yeast Chlamydia (chlamydia trachomatis)2 • Exists in two forms reticulate body (metabolically active) and elementary body (infectious) • Bacterial membranes contain various chain types including branched chains (10-20%) • Primarily zwitterionic and phosphatidylinositol head groups • 20-30% sterols E. coli (Escherichia coli)3 • Mixture of fully saturated and unsaturated chains • Fatty acid chains can contain cyclic moieties (cyclopropane) • Zwitterionic (~80% PE) and anionic (~20 %PG) head groups • Limited to no sterols 1Daum 2Wylie, J.L. et al. J. Bact. 179: 7233 (1997). G. et al. Yeast. 15: 601 (1999). & G. Larsson. Microbial Cell Factories. 3: 9 (2004) . 3Shokri, A. Membrane Composition within Cell Distribution of phospholipids (PL) vs. sterols1 · Mammals in dark blue and yeast in light blue · Plasma membrane (PM) contains a significant amount of sterol (largest of all organelles) · Mammalian PM contain more sterol than yeast · Endoplasmic reticulum (ER) manufactures sterol, but levels are low · Large diversity of phospholipids between mammals and yeast and within a cell 1van Meer, G. et al. Nature Rev. Mol. Cell. Bio. 9: 112 (2008). Force Fields Biomolecular Force Field (CHARMM) V ( Rˆ ) K b b 2 b bonds 0 K 2 0 angles K r UB 2 0 1, 3 r1, 3 cross UB K 1 cos2 im improper 12 6 R Rmin,ij qi q j min,ij K , j 1 cos(n j j ij r nonbonded r rij dihedrals j nonbonded ij pairs i , j D ij pairs i , j · Many terms to describe intra- and intermolecular interactions All-atom Lipid Force Fields • CHARMM Family: CHARMM27r and CHARMM36 (C27r1 and C362) • AMBER Family: GAFFlipid3 and Lipid144 • Stockholm Lipids (Amber-compatible): Slipid5 1Klauda, 2Klauda, 3Dickson 4Dickson J. B. et al. JPCB. 109: 5300 (2005). et al. Soft Matter. 8: 9617 (2012). 5Jämbeck & Lyubartsev. JPCB. 116: 3164 (2012). J.B. et al. JPCB. 114: 7830 (2010). et al. J. Chem. Theory Comput. 10: 865 (2014). AMBER Lipids Summary of Lipid14 FF1 Results (NPT Ensemble) Surface Area/lipid [Å2] MD DPPC DMPC DLPC DOPC 62.0±0.3 59.7±0.7 63.0±0.2 69.0±0.3 POPC POPE 65.6±0.5 55.5±0.2 Exp 63.0±1.0 60.6±0.5 63.2±0.5 67.4±1.0 68.3±1.5 ~60 · Generally good agreement with experiment (slight tendency to underestimate) Deuterium Order Parameters · Overall excellent agreement with NMR SCDs · POPE SCDs of the saturated chain are somewhat high, which may indicate that the SA/lipid is too low · Decent splitting for the C2 position (Fig. 71) · Unclear if the head group order parameters are in agreement with experiment • Procedure follows typical rules for AMBER FF optimization (RESP charges in gas phase) • Should only be used with the AMBER family of FF 1Dickson et al. J. Chem. Theory Comput. 10: 865 (2014). Stockholm Lipids (Slipids) Summary of Slipids1-3 Results (NPT Ensemble) Surface Area/lipid [Å2] MD DPPC DMPC DLPC DOPC 62.6±0.5 60.8±0.5 62.4±0.4 68.0±0.5 POPC POPE 64.6±0.4 56.3±0.4 Exp 63.0±1.0 60.6±0.5 63.2±0.5 67.4±1.0 68.3±1.5 ~60 · Generally good agreement with experiment (slight tendency to underestimate) Deuterium Order Parameters (Fig. 51) (Fig. 22) · Overall excellent agreement with NMR SCDs · Better POPE SCDs compared to Lipid14 · Decent splitting for the C2 position · Unclear if the head group order parameters are in agreement with experiment • Procedure similar to AMBER FF optimization (RESP charges in gas phase) • Extensions to PS, PG and SM lipids3 1Jämbeck 3Jämbeck & Lyubartsev. JPCB. 116: 3164 (2012). 2Jämbeck & Lyubartsev. J. Chem. Theory Comput. 8: 2938 (2012). & Lyubartsev. J. Chem. Theory Comput. 9: 774 (2013). Force Fields Continued Biomolecular Force Field (CHARMM) V ( Rˆ ) K b b 2 b 0 bonds K 2 0 angles K r UB 2 0 1, 3 r1, 3 cross UB K 1 cos2 im improper 12 6 R Rmin,ij qi q j min,ij K , j 1 cos(n j j ij r nonbonded r rij dihedrals j nonbonded ij pairs i , j D ij pairs i , j · Many terms to describe intra- and intermolecular interactions United Atom/Coarse-grained Lipid Force Fields • United atom: C27-UA(acyl)1, C36-UA2 and GROMOS3 • Coarse-grained: MARTINI4 and Shinoda/DeVane/Klein5 1Henin, Shinoda & Klein. JPCB. 112: 7008 (2008). 4Berger O. et al. BJ. 72: 2002 (1997). , 5Shinoda, DeVane, & Klein. JPCB. 114: 2Lee, Tran, Allsopp, Lim, Henin & Klauda. JPCB 118: 547 (2014). et al. JPCB. 111: 7812 (2007). 4Marrink 6836 (2010). Issues with the CHARMM27r FF Surface Tension • To maintain good agreement with density profiles and SCD, NPAT simulations at the experimental area are needed for MD simulations with C27r • Finite size effects may result in a non-zero surface tension,1 but C27r values are too high2 Surface Tension in dyn/cm LR LJ No LR-LJ Exp. Estimate DPPC bilayer (64 Å2/lipid, 323K) 19.7 16.8 ~0-5 DMPC bilayer (60.7 Å2/lipid, 303K) 19.8 -- ~0-5 Freezing or Phase Change with NPT · Freezing of aliphatic chains at T > Tb · Issue with lipids that have 1-2 fully saturated chains · Problematic when surface areas are not available for lipids and their mixtures 1Klauda, 2Klauda, J.B. et al. BJ. 90: 2796 (2006). J.B. et al. JPCB. 111: 4393 (2007). Modification of CHARMM Charges Charge/LJ Modification • Looked at small molecules and DPPC bilayer charges using semi-empirical AM1 · Increase in polarization occurred going from the gas phase to realistic bilayer · Therefore, increasing the lipid charges in the glycerol region is justified • Adjusted charges/LJ Dipole moment of methylacetate (debye) Dipole QM C27r C36 X/Y Ratio 1.48 -7.83 1.52 Total 1.65 2.40 1.52 · Adjustments are supported by AM1 on the bilayer, small molecule dipoles and watermolecule interactions. · Small adjustments on the carbonyl carbon LJ parameters with the ester oxygen taken from previous optimizations1 1Vorobyov, I, et al. J. Chem. Theory and Comp. 3: 1120 (2007). Dihedral Modifications V ( Rˆ ) K b b b0 2 bonds K 0 2 angles K 1 cos( n , j j j dihedrals j 12 6 R R qi q j min,ij min,ij ij r nonbonded r rij nonbonded ij pairs i , j D ij pairs i , j Small Molecule Models of DPPC 1Klauda et al. JPCB. 114: 7830 (2010). Fits to QM of small molecules QM of bilayers (Alex MacKerell) Dihedral Modifications: CHARMM36 Glycerol FF Adjustments • Adjust the g1 torsion 2 4 b 1 g1 MP2/6-31g(d): 648 Energy Points • Issues fitting the 4 and b1 torsions kcal/mol 1Klauda et al. JPCB. 114: 7830 (2010). Empirical Fits of Torsions (C36) DPPC SCD Targets • MD simulations of the DPPC bilayer with an intermediate FF were used to empirically fit 2, 4, and b1 torsions. • Populations of trans and gauche conformations of these torsions were optimized G+ T G- 2 18% 36% 45% 4 66% 3% 31% b1 56% 43% 1% · The torsional potential was adjusted to bound the PMFs based on these fits and the optimal set was chosen. 1Klauda et al. JPCB. 114: 7830 (2010). Empirical Fits of Torsions (C36) Torsional surface scans from 20 ns MD simulations 1Klauda et al. JPCB. 114: 7830 (2010). DPPC Bilayer and C36 Deuterium Order Parameters (SCD): NPAT/NPT1 vs. Experiment2 NPAT A=64Å2 NPT S CD 1.5 cos 2 CH 0.5 · Excellent agreement with experiment and fairly independent of the ensemble. 1Klauda, J. B. et al. JPCB. 114: 7830 (2010). 2Seelig, A. & J. Seelig. Biochem. 13: 4839 (1974). DPPC Bilayer Density Profiles & Form Factors Compared to Experiment1 Aexp=63±1Å2 · Good agreement with the experimental form factors, F(q) · The methyl & methylene density is improved · NPT captures the overall and component densities correctly 1Kučerka, N. et al. BJ. 95: 2356 (2008). CHARMM36 Lipids Initial Parameterization with PC & PE lipids Surface Area/lipid [Å2] DPPCa DMPCb DLPCb MD 62.9±0.3 60.8±0.2 Exp 63.0±1.0 60.6±0.5 DOPCb POPCb POPEc 64.4±0.3 69.0±0.3 64.7±0.2 59.2±0.3 63.2±0.5 67.4±1.0 68.3±1.5 ~60 Additional Lipids • Lipids with polyunsaturated chains2 DAPC • Branched and cyclic-containing chains (important for certain bacteria)3,4 • Sterols (cholesterol, oxysterols, ergosterol)5 • Various published parameters: PS, PG, PA and Cardiolipin • Other lipid parameters on the way: PI, PIP, SM, and CER 1Klauda 2Klauda 3Lim 4Pandit et al. JPCB. 114: 7830 (2010). & Klauda. BBA: Biomemb. 1808: 323 (2011). 5Lim et al. JPCB. 116: 203 (2012). et al. JPCB. 116: 9424 (2012). & Klauda. BBA: Biomemb. 1818: 1818 (2012). a323K b303K c310K CHARMM-GUI CHARMM-GUI.org – Membrane Builder1,2 Dr. Im (KU) • Allows for easy building of lipid membranes • Select from 140+ lipids and any mixture from these lipids • Builds membranes and provides rigorously tested equilibration inputs for CHARMM and NAMD simulations • Membrane proteins can be easily incorporated into the bilayer • Freely available to any researcher 1Jo, 2Jo, Kim, Iyer & Im. J. Comput. Chem. 29: 1859 (2008) . Lim, Klauda & Im. Biophys. J. 97: 50 (2009). CHARMM-GUI CHARMM-GUI.org – Membrane Builder1,2 • Can easily build heterogeneous bilayers • Specify water hydration in three ways (defaults are safe for fully hydrated bilayers) • Can choose ratio or number of lipids for each leaflet • Reported surface area per lipid is based on simulations with a pure membrane • Further steps ask for ion concentration, ring penetration checks, ensemble and temperature • At the end (or during the process) you can download the files in .tgz format (all files needed to simulate bilayer) 1Jo, 2Jo, Kim, Iyer & Im. J. Comput. Chem. 29: 1859 (2008) . Lim, Klauda & Im. Biophys. J. 97: 50 (2009). CHARMM-GUI Output Initial Structure of Bilayer • Water is initially away from bilayer (will quickly fill in the vacuum space). • Lipid head groups are aligned to a specific z-position based on prefered location in the bilayer • Chains can tangle and careful equilibration is required Restraints During Equilibration • Water away from hydrophobic core • Head group and tails to appropriate regions • Double bonds in their respective cis or trans conformation • Ring conformations (chair & upright for PI lipids) 1Jo, 2Jo, Kim, Iyer & Im. J. Comput. Chem. 29: 1859 (2008) . Lim, Klauda & Im. Biophys. J. 97: 50 (2009). MD Simulations of Membranes Caveats of CHARMM-GUI with membranes • Membrane surface area/volume · Primarily based on SA from pure lipid bilayers with C36 force field at 303K · Some lipids have high gel transition temperatures >303K and values are based on higher temps · This can result in poor initial guess for mixed lipid systems, especially with sterols · If the SA is known or can be estimated a priori then this is preferred • Membrane equilibration · Although we have tested this extensively there might be some issues · Pay careful attention to your bilayer lipids · Make sure all bonds are maintained after equilibration, otherwise results will be off · Building the membrane may cause chain overlap · Internal checks for ring penetration by chain (chain through cholesterol or amino acid rings) · If these exist, then you need to rebuild the system! Simulation Snapshot ERG, YOPS, DYPC and water Multilayer System/Periodic Boundary Conditions ST-Analyzer Web-based Interface for Simulation Trajectory Analysis1 Dr. Im (KU) • Allows for easy collection of data on membranes and proteins • Can be setup to on a workstation or a cluster environment with batch submission of analysis 1Jeong et al. J. Comput. Chem. 35: 957 (2014) . Membrane Area per Lipid Equilibrated? Thermal Equilibration NPT-Production • Things to consider with membrane equilibration · Possible transient stability in volume/surface area · Must run for long periods of time: 10-30ns for simple single lipids and 50-300 ns (or longer) for complex mixtures (General rules of thumb without phase transitions) · Current run suggest longer times (beyond 20ns) are needed Membrane Area per Lipid: Examples • Equilibration is slower during changes in phase (La to gel- like phase) • 100ns or greater can be required to obtain a fully equilibrated bilayer even for single lipids DPPC at 200 ns (303K) z Lipid Bilayer Structure: Simulation Molecular Dynamics • Simulations can easily obtain density profiles Bulk Water Headgroup Dz=0.1Å Count number electrons/bin and average 1Jo, 2Jo, Kim, Iyer & Im. J. Comput. Chem. 29: 1859 (2008) . Lim, Klauda & Im. Biophys. J. 97: 50 (2009). SM=Structural Model Hydrophobic/Chain Lipid Bilayer Structure: Experiment Form Factors F(q) • F(q) is transformed into real space to get structural properties Structural Models EDP, A Fourier Reconstruction Only Total EDP & Fourier Wiggles F(q) HB Fit to Exp. F(q) for the DMPC Bilayer1 1Kučerka, N. et al. Biophys. J. 88: 2626 (2005). Development of H2 Structural Model Density Profile • Component electron density used to guide model development Asim=60.7 Å2 Black & Blue: Simulation Red: H2 fit to density New Hybrid Model (H2)1 • Consists of five physical components H2 z P z M z CG z CH z BC z 2 CH z CCH pHC z, DC , CH 8rCH 9GM z,0, M 2 1Klauda, 2 J.B. et al. Biophys. J. 90: 2796 (2006). 2 3 BC=water+choline CG=carbonyl-glycerol chol = choline Comparing to X-ray/Neutron Scattering Model Free Comparison • Form Factors (symmetric bilayers, where D-repeat spacing) F qz f q n z a z a W cos zq z i sin zq z dz D / 2 a D/2 fa(q): atomic form factors (depend on q for X-ray (not neutron data)) na(z): atomic number distribution (density of atoms of each type) W: scattering density of water (solvent) • Method to use and program · Calculate atomic densities (na(z)) (in CHARMM or ST-Analyzer) and use SIMtoEXP program1 · Load in atomic density to SIMtoEXP program to get F(q) 1Kučerka et al. J. Membr. Biol. 235: 43 (2010). Examples for C36 POPC Form Factors & Density Profiles1 0.5 2.5 2 0.2 d 0.4 0.6 q [1/Å] 50°C 1.5 1 0.5 0 0 0.2 0.4 0.6 q [1/Å] 0.8 30°C SIM 1 0.5 2.5 2 0.2 e 0.4 0.6 q [1/Å] 60°C 1 0.5 0 0 0.5 XRay SIM 0.45 0.4 0.35 1 0.5 0.2 0.4 0.6 q [1/Å] 0.8 · Can easily obtain density profiles of groups within the bilayer Makover, Im & Klauda. BBA-Biomemb. Submitted (2014). XRay SIM 40°C 1.5 1.5 0 0 c 2 0.8 · Excellent agreement between experiment and MD simulation for form factors. 1Zhuang, 2.5 XRayULV XRayORI 1.5 0 0 0.8 XRay SIM 2 b |F(q)| [e/Å2] 1 2.5 ED [e/Å3] XRay SIM 1.5 0 0 |F(q)| [e/Å2] 20°C |F(q)| [e/Å2] 2 a |F(q)| [e/Å2] |F(q)| [e/Å2] 2.5 0.3 0.2 0.4 0.6 q [1/Å] Total Water Choline Phosphate Glycerol Carbonyl CH2 CH CH3 0.8 d POPC 0.25 0.2 0.15 0.1 0.05 0 0 5 10 15 z [Å] 20 25 Overview of Lipid Dynamics and Internal Structure Range of Lipid Motions 0 Wobbling in a Cone Model1 Bond Vibrations 1ps Hydrogen Bonds 1ns Internal Isomerization (C-H, P-H, etc.) and Wobbling3 10ns Isomerization Axial Rotation Lipid Axial Rotation3 Lateral Diffusion2 1ms Vesicle Rotation Wobbling Internal Structure • Orientation of bonds • Angle of bond vectors with respect to bilayer normal Methods to obtain these Quantities • NMR • Molecular dynamics 1Pastor, 3Klauda R.W. et al. Accounts. Chem. Res. 35: 438 (2002). et al. Biophys. J. 94: 3074 (2008). 2Klauda et al. J. Chem. Phys. 125: 144710 (2006). NMR Background Nuclear Magnetic Resonance (NMR) • Magnetic nuclei (13C/31P) respond to an oscillating magnetic field • Spin-lattice relaxation rates (R1) R1 R1 (dipolar) R1 (CSA) • Dipolar term: nuclear spin interaction between neighbors 2 2 g Pg H m 0 1 J (H P ) 3J (P ) 6 J (H P ) R1 (dipolar) 0.1 3 4 rP H J () C2 (t ) cos(t )dt 0 ˆ (0) m ˆ (t) C2 t P2 m 2nd Order Legendre Polynomial Spectral Density Reorientational Correlation Function Unit vector between P and its neighboring H NMR Background Nuclear Magnetic Resonance (NMR) • Magnetic nuclei (13C/31P) respond to an oscillating magnetic field • Spin-lattice relaxation rates (R1) R1 R1 (dipolar) R1 (CSA) • Chemical Shift Anisotropy: on nucleus R1(CSA) J 2 15 2 P 2 2 ( ) 1 /3 CSA P · Based on sold-state measurements on lipids1 · Major principal axis1 (33) is used to obtain the spectral density · The asymmetry in principal axis is accounted for by • Field dependence · Dipolar contribution is important at low field · CSA is important at high field 1Herzfel, J. et al. Biochem. 17: 2711 (1978). Deuterium NMR Deuterium NMR • Order parameters · i is the angle of a C-D vector with the bilayer normal (usually the z axis) • Internal structure of lipids How obtain this via MD Simulations • Calculate the C-H angle (MD simulations without deuterium) • Do this for every carbon • Simple trig calculation Deuterium NMR: Examples SCD’s for POPC and DLPC1 0.1 0.05 DLPC sn-2 0.1 0.1 0.05 0.15 0.1 0.05 4 6 8 10 Carbon Number 12 0 2 b POPC sn-2 0.15 0.1 DLPC sn-1 20°C 30°C 40°C 50°C 60°C 4 6 8 10 Carbon Number 0 2 4 6 8 10 12 14 16 18 Carbon Number 0.2 DLPC sn-2 0.15 0.1 0.05 12 c 0 2 SIM 20°C NMR 20°C SIM 40°C NMR 40°C 4 6 8 10 Carbon Number · Higher values indicate more order (lower disorder) · Double bond adds a kink to the chain and more disorder · SCDs depend on temperature and agree fairly well with experimental data 1Zhuang, Makover, Im & Klauda. BBA-Biomemb. Submitted (2014). SIM 30°C NMR 27°C 0.05 0 2 4 6 8 10 12 14 16 18 Carbon Number 0.2 SCD SCD a 0.15 0 2 10°C 20°C 30°C 40°C 50°C 60°C 0.05 0 2 4 6 8 10 12 14 16 18 Carbon Number 0.2 0.15 0.2 SCD 0.15 c POPC sn-1 0.2 SCD SCD 0.2 b POPC sn-2 SCD a 12 Summary • There are many lipid types that can exist in biology and each has it own function to the cell • Lipid diversity in biology can vary between different head groups to chain types • Lipids from in vivo membranes are diverse between organisms and organelles with a single organism • There are several options for lipid force fields to run MD simulations (all-atom, united-atom and coarse-grained) • CHARMM36 lipid force field has been parameterized and agrees well with a multitude of experiments (dynamical and structural) for all regions of the lipid • CHARMM-GUI allows for easy building of simple and complex membranes with/without proteins • ST-Analyzer allows for easy access and analysis of simulation trajectories from many different simulation program platforms • A key test for bilayer equilibration is the surface area per lipid • Structural (SCD and density profiles) and dynamical properties (diffusion and relaxation rates) can easily be obtained with proper analysis of MD simulations

