Line Shape
advertisement
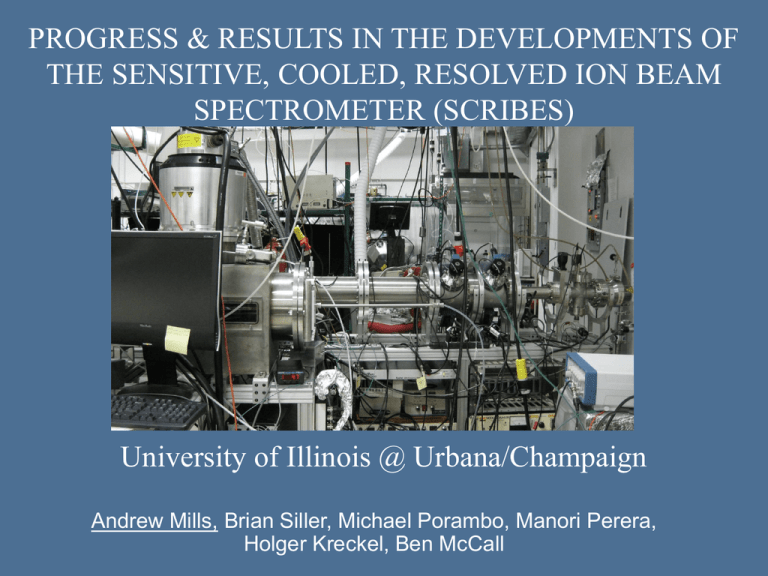
PROGRESS & RESULTS IN THE DEVELOPMENTS OF THE SENSITIVE, COOLED, RESOLVED ION BEAM SPECTROMETER (SCRIBES) University of Illinois @ Urbana/Champaign Andrew Mills, Brian Siller, Michael Porambo, Manori Perera, Holger Kreckel, Ben McCall Ion Beam NICE-OHMS • • • • • • • Motivation Ion beam setup Line shape N2+ signal Sensitivity Spectroscopy characteristics Future plans Motivations for studying molecular ions Fundamental: Structure of molecular ions Astrochemical Systems: Drive chemistry in interstellar medium (ISM) Need spectra to locate in ISM Challenges to studying ions Reactive, transient species: Production under harsh conditions (discharge) Discharges often rotationally and vibrationally excited ions Weak signal from dilute analyte Large background of neutrals and other excited species Direct Absorption Ion Spec. Techniques High ion density Ion-neutral discrimination Low rotational temperature Narrow linewidth Cavity-enhanced spectroscopy Mass Spectrum Mass ID of Spectral Line Hollow Cathode Supersonic Expansion Setup CE Velocity Ion Beam Velocity Modulation Modulation Sensitive Cooled Resolved Ion BEam Spectroscopy S _ R I Be S Laser retractable Brewster Faraday cup window Einzel lens 2 TOF beam modulation electrodes electrostatic deflector 2 drift tube (overlap) variable apertures electrostatic deflector 1 steerers ion source wire beam profile monitors Ion source – Currently uncooled Ion optics Current measurements Co-linearity with laser Mass spectrometer Laser coupling Concentration / velocity modulation electron multiplier TOF detector Einzel lens 1 Faraday cup Brewster window EOM Laser Cavity Modes Sideband spacing Coe et al., JCP 90, 3893 (1989) Mass ID Mass ID of Spectroscopic Lines Red “Transition” 10 10865.05 10865.15 10865.20 1.0 5 0.8 0.8 0.8 0.6 0.6 0.6 0.4 0.4 0.4 -5 0.2 0.2 0.2 0.0 0.0 0.0 10865.25 6 4 2 0 0 -2 -4 -6 -10 9999.96 Ion Beam Laser 9999.98 10000.00 10000.02 10000.04 9999.96 9999.98 10000.00 10000.02 10000.04 9999.96 9999.98 10000.00 10000.02 10000.04 10853.45 10853.50 10853.50 10853.55 10859.34410853.60 10865.20 10865.25 10853.45 10853.65 10853.70 -1 Frequency (cm ) Line Shape ' 2qV 1 2 Mc -6 x10 10865.10 1.0 Blue “Transition” x10 -6 1.0 Rest “Transition” ABSORPTION fm 0 999.98 999.98 DISPERSION CM Line shape 0.6 0.4 0.2 0.0 -0.2 -0.4 -0.6 10000.00 10000.02 10000.04 2 9.99996 9.99998 10.00000 3 x10 10.00002 9999.98 10000.00 10000.0 1 0 -1 -2 10000.00 10000.02 1.5 10000.04 1.0 0.5 Overall line shape 0.0 -0.5 -1.0 -1.5 9999.96 ABSORPTION DISPERSION VM Line shape 1.5 1.0 0.5 0.0 Concentration Modulation Line shape -0.5 -1.0 10 V 9999.98 9999.98 10000.00 vm 10000.00 10000.02 10000.02 -1.5 10000.04 1.5 10000.04 1.0 0.5 0.0 1 1 -0.5 -1.0 0 0 -1.5 9999.96 9999.98 10000.00 1000 9999.96 9999.98 10000.00 10000.02 -1.5 -1.0 -0.5 0.0 0.5 1.0 1.5 9999.96 10000.00 10000.02 10000.04 -1 ABSORPTION Velocity Modulation -1 DISPERSION -2 -2 -3 -3 9999.98 10000.00 10000.02 10 Example Spectra DISPERSION 4.0 t =3.51 s 20 3.0 10 x10 -6 2.5 2.0 0 1.5 -10 1.0 0.5 -20 9999.98 10000.00 10000.02 10865.24 10000.04 10865.26 10000.04 -1 10000.00 Concentration Modulation 10865.28 Frequency (cm ) 4.0 VBeam ~ 3865 V 150 3.5 100 q 3.0 Q22(14.5) N2+ x10 -6 50 2.5 0 2.0 -50 1.5 -100 1.0 -150 0.5 Velocity Modulation 10865.24 10865.26 -1 Frequency (cm ) 10865.28 t = 30 s Sensitivity Expected fractional signal strength: Cavity Path Line Ion Heterodyne Loss Finesse length Strength Density Linewidth Equivalent Fractional Absorption Observed Expected Factor off N2+ VM 2.71E-07 5.25E-07 1.94 N2+ CM 1.48E-07 4.62E-07 3.11 HN2+ VM 2.4E-06 Mid IR implications: HN2+ without any rotational cooling Spectroscopy of larger carbocations (like CH5+ and C3H3+) will require rotational cooling S_RIBES Characteristics Ion density 6x10⁶ ion/cm3 Ion neutral discrimination Sensitive Cooled Resolved Ion BEam Spectroscopy Complete spatial, and modulation discrimination from excited neutrals. Rotational temperature ~ 600 K. Surprisingly low temperature. Supersonic cooling available. Linewidth ~ 120 MHz in the NIR. ~33 MHz in midIR. Mass spectrometry of ions Confirms species probed… Optimize plasma conditions. Mass ID of spectral lines NICE-OHMS VMS DFG Ti:Sapph Frequency comb Wavemeter YAG Function generator PPLN LP Piezo Preliminary Optimization Increased finesse and refined laser locking 20 V 4.0 150 3.5 HF+ 100 3.0 t = 30 s 50 x10 -6 2.5 0 2.0 -50 1.5 -100 -1 10865.24 -20 20 1.0 Frequency (cm ) -150 10865.26 4.0 10865.24 10865.26 10 V Frequency (cm -1 ) 10865.28 0.5 3.5 1.0 3.0 -10 10 -6 1.5 2.5 0 0 2.0 2.0 6- 01x10 x 0.5 10865.28 2.5 1.5 10 -10 3.0 1.0 3.5 0.5 20 -20 4.0 10865.24 10865.26 -1 Frequency (cm ) 10865.28 t = 10 s Coe et al., JCP 90, 3893 (1989) Conclusions • Using NICE-OHMS, an N2+ equivalent absorption signal has been obtained from our ion beam. • The NICE-OHMS-S_RIBES technique: – – – – – Yields narrow linewidth spectral lines Yields mass ID for every spectral line Yields complete ion/neutral discrimination Is compatible with supersonic cooling Is sensitive enough to compensate for low ion density • The signal strength matches up with expected values. • Construction of a mid-IR DFG NICE-OHMS setup will soon begin. Acknowledgments Air Force Young Investigator Award Dreyfus New Faculty, TeacherScholar Awards NASA Laboratory Astrophysics NSF Chemistry, Physics, Astronomy Packard Fellowship Cottrell Scholarship Visit us at: http://bjm.scs.uiuc.edu Sloan Fellowship


