Graphing the Quadratic Function Using Transformations
advertisement

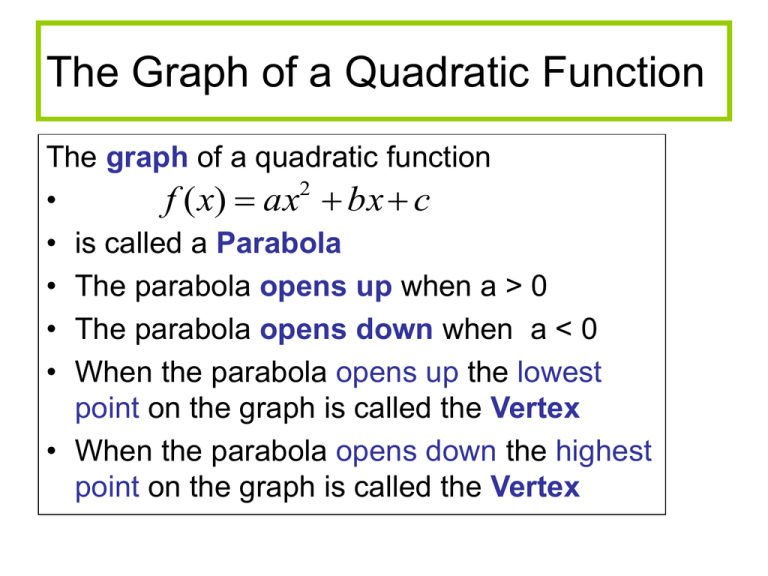
The Graph of a Quadratic Function The graph of a quadratic function 2 • f ( x) ax bx c • is called a Parabola • The parabola opens up when a > 0 • The parabola opens down when a < 0 • When the parabola opens up the lowest point on the graph is called the Vertex • When the parabola opens down the highest point on the graph is called the Vertex The Graph of a Quadratic Function (cont) • The Vertex of a quadratic function is a pair (x, y) where the x coordinate is sometimes denoted by h and the y by k. 2 The function f (x) = ax +bx + c can be written in the form 2 f (x) = a (x + h) + k by completing the square Graphing the Quadratic Function Using Transformations Given the Quadratic function x 2 2x 3 We complete the square and get 2 f (x)=(x -1) – 4. Here h = 1 and k = -4 The graph is y = x shifted horizontal right 1 unit and vertically down 4 units. The result is given below 2 Graph of a Quadratic Function 2 f (x)=(x -1) - 4 (1,-4) vertex Graphing the Quadratic Function Using Transformations To find the vertex of the given function 2 f (x) = 3x + 6x +2 We write f (x) as 2 3(x + 2x ) + 2 then 2 3(x + 2x +1 ) + 2 -3(1) 3(x + 1) 2 -1 Graph of a Quadratic Function 2 2 y = 3x + 6x +2 2 Vertex(-1, -1) 2 y = (x + 1) -1 The Graph of a Quadratic Function The vertical line which passes through the vertex is called the Axis of Symmetry or the Axis Recall that the equation of a vertical line is x =c For some constant c x coordinate of the vertex b 2a 4ac b 2 The y coordinate of the vertex is 2a The Axis of Symmetry is the x = b 2a The Quadratic function • Opens up when a>o opens down a < 0 Vertex axis of symmetry Identify the Vertex and Axis of Symmetry of a Quadratic Function • Vertex =(x, y). thus • Vertex = b , f b 2a 2a • Axis of Symmetry: the line x = b 2a • Vertex is minimum point if parabola opens up • Vertex is maximum point if parabola opens down Identify the Vertex and Axis of Symmetry f ( x) 3x 6x 2 • Vertex x = y= b 2a = 6 2(3) = -1 b f f 1 -3 2a • Vertex = (-1, -3) b • Axis of Symmetry is x = 2a = -1 Steps for Graphing Quadratic Function Method I Given the Quadratic 2 f (x) = ax + bx + c = 0 a 0 1. Complete the square to write the function as 2 f (x) = a (x – h) + k 2. Graph function in stages using transformation Steps for Graphing Quadratic Function Method 2 Determine 1. the vertex b b , f 2a 2a 2. the Axis of Symmetry: the line x = 3. the y intercept. That is f(0) b 2a Steps for Graphing Quadratic Function(cont.) 4. Determine the x–intercept, that is, f (x) = 0 a. If b 2 4ac 0 there are 2 x-intercepts and the graph crosses the x axis at 2 points b. If there is 1 x-intercept b 2 4ac 0 and the graph crosses the x axis at 1 point c. If there are no x-intercepts b 2 4ac 0 and the graph does not cross the x axis. 5. Use the Axis of Symmetry and y –intercept to get an additional point and plot the points Finding the Maximum and Minimum Points • If the parabola opens up, that is, if a > 0 • the vertex is the lowest point on the graph and the y coordinate of the vertex is the minimum point of the quadratic function If the parabola opens down, that is, if a < 0 the vertex is the highest point on the graph and the y coordinate of the vertex is the maximum point of the quadratic function Finding the Maximum and Minimum Points Page 153 # 60 Find the maximum or minimum 2 f (x) = -2x + 12x a = -2 < 0. Thus the parabola opens down and has a maximum b 12 Vertex x = 2 a = = 3 2(2) y = f(3) = 18 Vertex = (3, 18) Maximum is y = 18 Finding the Maximum and Minimum Points • • • • • 2 f(x) = 4x – 8x + 3 a = 4 >0. Thus the parabola opens up and has a minimum Vertex (x = -(-8)/2(4) = 1, y=f(1)= -1) Vertex(1, -1) Minimum = y=f(1)= -1 • Note the range is y -1


