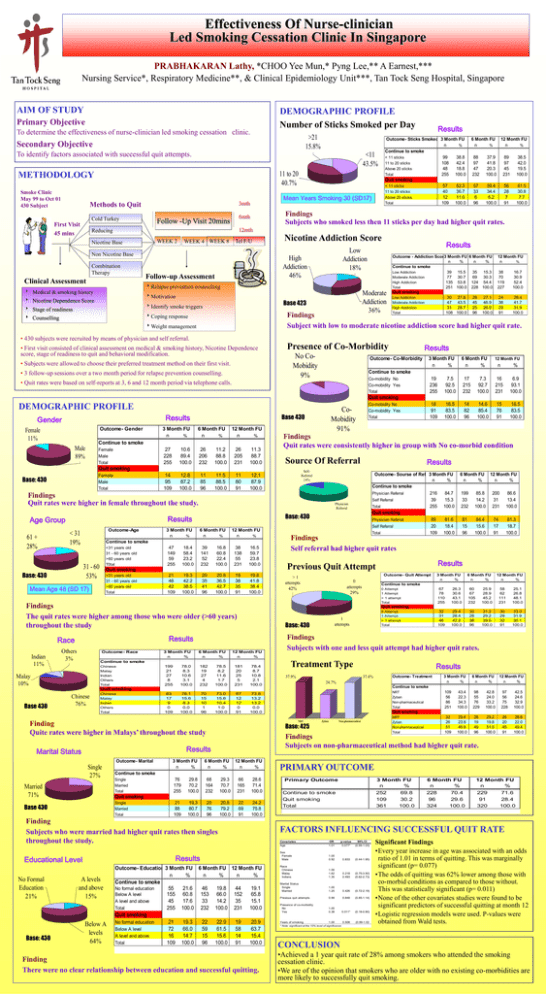
Effectiveness Of Nurse-clinician
Led Smoking Cessation Clinic In Singapore
PRABHAKARAN Lathy, *CHOO Yee Mun,* Pyng Lee,** A Earnest,***
Nursing Service*, Respiratory Medicine**, & Clinical Epidemiology Unit***, Tan Tock Seng Hospital, Singapore
AIM OF STUDY
DEMOGRAPHIC PROFILE
Number of Sticks Smoked per Day
Primary Objective
To determine the effectiveness of nurse-clinician led smoking cessation clinic.
>21
15.8%
Secondary Objective
To identify factors associated with successful quit attempts.
Smoke Clinic
May 99 to Oct 01
430 Subject
11 to 20
40.7%
Mean Years Smoking 30 (SD17)
3mth
Methods to Quit
Cold Turkey
First Visit
45 mins
Outcome- Sticks Smoked 3 Month FU
n
%
Continue to smoke
< 11 sticks
99
38.8
11 to 20 sticks
108
42.4
Above 20 sticks
48
18.8
Total
255 100.0
Quit smoking
< 11 sticks
57
52.3
11 to 20 sticks
40
36.7
Above 20 sticks
12
11.0
Total
109 100.0
<11
43.5%
METHODOLOGY
6 Month FU
n
%
12 Month FU
n
%
88
97
47
232
37.9
41.8
20.3
100.0
89
97
45
231
38.5
42.0
19.5
100.0
57
33
6
96
59.4
34.4
6.2
100.0
56
28
7
91
61.5
30.8
7.7
100.0
Findings
Subjects who smoked less then 11 sticks per day had higher quit rates.
6mth
Follow -Up Visit 20mins
Results
12mth
Reducing
WEEK 2
Nicotine Base
WEEK 4 WEEK 8
Tel F/U
Non Nicotine Base
Combination
Therapy
Clinical Assessment
Nicotine Addiction Score
Low
Addiction
18%
High
Addiction
46%
Follow-up Assessment
Results
Relapse prevention counselling
Medical & smoking history
Motivation
Nicotine Dependence Score
Base 423
Identify smoke triggers
Stage of readiness
12 Month FU
n
%
38
70
119
227
16.7
30.9
52.4
100.0
24
38
29
91
26.4
41.7
31.9
100.0
Findings
Subject with low to moderate nicotine addiction score had higher quit rate.
Coping response
Counselling
Moderate
Addiction
36%
Outcome - Addiction Score
3 Month FU 6 Month FU
n
%
n
%
Continue to smoke
Low Addiction
39 15.5
35
15.3
Moderate Addiction
77 30.7
69
30.3
High Addiction
135 53.8 124 54.4
Total
251 100.0 228 100.0
Quit smoking
Low Addiction
30 27.8
26
27.1
Moderate Addiction
47 43.5
45
46.9
High Addiction
31 28.7
25
26.0
Total
108 100.0 96 100.0
Weight management
• 430 subjects were recruited by means of physician and self referral.
• First visit consisted of clinical assessment on medical & smoking history, Nicotine Dependence
score, stage of readiness to quit and behavioral modification.
Results
Presence of Co-Morbidity
No CoMobidity
9%
• Subjects were allowed to choose their preferred treatment method on their first visit.
• 3 follow-up sessions over a two month period for relapse prevention counselling.
• Quit rates were based on self-reports at 3, 6 and 12 month period via telephone calls.
Outcome- Co-Morbidity
3 Month FU
n
%
6 Month FU
n
%
12 Month FU
n
%
19
236
255
7.5
92.5
100.0
17
215
232
7.3
92.7
100.0
16
215
231
6.9
93.1
100.0
18
91
109
16.5
83.5
100.0
14
82
96
14.6
85.4
100.0
15
76
91
16.5
83.5
100.0
Continue to smoke
Co-mobidity No
Co-mobidity Yes
Total
Quit smoking
DEMOGRAPHIC PROFILE
Results
Gender
Outcome- Gender
Female
11%
Base 430
3 Month FU
n
%
6 Month FU
n
%
12 Month FU
n
%
27
228
255
10.6
89.4
100.0
26
206
232
11.2
88.8
100.0
26
205
231
11.3
88.7
100.0
14
95
109
12.8
87.2
100.0
11
85
96
11.5
88.5
100.0
11
80
91
12.1
87.9
100.0
Continue to smoke
Male
89%
Female
Male
Total
Findings
Quit rates were consistently higher in group with No co-morbid condition
Base: 430
SelfReferral
14%
Findings
Quit rates were higher in female throughout the study.
61 +
28%
Outcome-Age
< 31
19%
6 Month FU
n
%
12 Month FU
n
%
47
149
59
255
18.4
58.4
23.2
100.0
39
141
52
232
16.8
60.8
22.4
100.0
38
138
55
231
16.5
59.7
23.8
100.0
21
46
42
109
19.3
42.2
38.5
100.0
20
35
41
96
20.8
36.5
42.7
100.0
18
38
35
91
19.8
41.8
38.4
100.0
Continue to smoke
<31 years old
31 - 60 years old
>60 years old
T0tal
31 - 60
53%
Base: 430
3 Month FU
n
%
Quit smoking
<31 years old
31 - 60 years old
>60 years old
Total
Mean Age 48 (SD 17)
Findings
The quit rates were higher among those who were older (>60 years)
throughout the study
Indian
11%
Others
3%
Outcome- Race
Malay
10%
Outcome- Quit Attempt
0
attempts
29%
Base 430
Chinese
76%
3 Month FU
n
%
6 Month FU
n
%
199
21
27
8
255
78.0
8.3
10.6
3.1
100.0
182
19
27
4
232
78.5
8.2
11.6
1.7
100.0
181
20
25
5
231
78.4
8.7
10.8
2.1
100.0
83
17
9
0
109
76.1
15.6
8.3
0.0
100.0
70
15
10
1
96
73.0
15.6
10.4
1.0
100.0
67
12
12
0
91
73.6
13.2
13.2
0.0
100.0
12 Month FU
n
%
Single
27%
Married
71%
3 Month FU
n
%
6 Month FU
n
%
12 Month FU
n
%
76
179
255
29.8
70.2
100.0
68
164
232
29.3
70.7
100.0
66
165
231
28.6
71.4
100.0
21
88
109
19.3
80.7
100.0
20
76
96
20.8
79.2
100.0
22
69
91
24.2
75.8
100.0
Quit smoking
Single
Married
Total
Base 430
Finding
Subjects who were married had higher quit rates then singles
throughout the study.
Results
Educational Level
No Formal
Education
21%
Base: 430
A levels
and above
15%
Below A
levels
64%
84.4
15.6
100.0
74
17
91
81.3
18.7
100.0
6 Month FU
n
%
67
78
110
255
26.3
30.6
43.1
100.0
60
67
105
232
25.9
28.9
45.2
100.0
58
62
111
231
25.1
26.8
48.1
100.0
32
31
46
109
29.4
28.4
42.2
100.0
30
28
38
96
31.2
29.2
39.6
100.0
30
29
32
91
33.0
31.9
35.1
100.0
0 Attempt
1 Attempt
> 1 attempt
Total
1
attempts
29%
12 Month FU
n
%
Results
37.9%
Outcome- Treatment
37.4%
24.7%
3 Month FU
n
%
6 Month FU
n
%
Outcome- Education 3 Month FU 6 Month FU 12 Month FU
n
%
n
%
n
%
Continue to smoke
No formal education
55
21.6
46
19.8
44
19.1
Below A level
155 60.8 153 66.0 152
65.8
A level and above
45
17.6
33
14.2
35
15.1
Total
255 100.0 232 100.0 231 100.0
Quit smoking
No formal education
21
19.3
22
22.9
19
20.9
Below A level
72
66.0
59
61.5
58
63.7
A level and above
16
14.7
15
15.6
14
15.4
Total
109 100.0 96 100.0 91
100.0
Finding
There were no clear relationship between education and successful quitting.
12 Month FU
n
%
109
56
86
251
43.4
22.3
34.3
100.0
98
55
76
229
42.8
24.0
33.2
100.0
97
56
75
228
42.5
24.6
32.9
100.0
32
26
51
109
29.4
23.8
46.8
100.0
28
19
49
96
29.2
19.8
51.0
100.0
26
20
45
91
28.6
22.0
49.4
100.0
Continue to smoke
NRT
Zyban
Non-pharmaceutical
Total
Quit smoking
Zyban
NRT
Zyban
Non-pharmaceutical
Total
Non-pharmaceutical
Findings
Subjects on non-pharmaceutical method had higher quit rate.
Continue to smoke
Single
Married
Total
81
15
96
3 Month FU
n
%
0 Attempt
1 Attempt
> 1 attempt
Total
Treatment Type
Base: 425
Results
Outcome- Marital
86.6
13.4
100.0
Findings
Subjects with one and less quit attempt had higher quit rates.
NRT
Finding
Quite rates were higher in Malays’ throughout the study
Marital Status
200
31
231
Continue to smoke
Quit smoking
Chinese
Malay
Indian
Others
Total
85.8
14.2
100.0
Results
Previous Quit Attempt
>1
attempts
42%
12 Month FU
n
%
199
33
232
Findings
Self referral had higher quit rates
Base: 430
Continue to smoke
Chinese
Malay
Indian
Others
Total
6 Month FU
n
%
Quit smoking
Results
Race
Outcome- Sourse of Referal
3 Month FU
n
%
Continue to smoke
Physician Referral
216
84.7
Self Referral
39
15.3
Total
255 100.0
Quit smoking
Physician Referral
89
81.6
Self Referral
20
18.4
Total
109 100.0
Physician
Referral
86%
Base: 430
Results
Age Group
Results
Source Of Referral
Quit smoking
Female
Male
Total
CoMobidity
91%
Co-mobidity No
Co-mobidity Yes
Total
PRIMARY OUTCOME
Primary Outcome
Continue to smoke
Quit smoking
Total
3 Month FU
n
%
6 Month FU
n
%
12 Month FU
n
%
252
109
361
228
96
324
229
91
320
69.8
30.2
100.0
70.4
29.6
100.0
71.6
28.4
100.0
FACTORS INFLUENCING SUCCESSFUL QUIT RATE
Covariates
Age
OR
1.01
p-value
0.077*
95% CI
(0.99-1.03)
Sex
Female
Male
1.00
0.92
0.833
(0.44-1.95)
Race
Chinese
Malay
Indians
1.00
1.62
1.30
0.218
0.493
(0.75-3.50)
(0.62-2.73)
Marital Status
Single
Married
1.00
1.25
0.426
(0.72-2.19)
Previous quit attempts
0.99
0.848
(0.85-1.14)
Presence of co-morbidity
No
Yes
1.00
0.38
0.011*
(0.18-0.80)
Years of smoking
1.00
0.508
(0.99-1.02
Significant Findings
•Every year increase in age was associated with an odds
ratio of 1.01 in terms of quitting. This was marginally
significant (p= 0.077)
•The odds of quitting was 62% lower among those with
co-morbid conditions as compared to those without.
This was statistically significant (p= 0.011)
•None of the other covariates studies were found to be
significant predictors of successful quitting at month 12
•Logistic regression models were used. P-values were
obtained from Wald tests.
* Note: significant at the 10% level of significance
CONCLUSION
•Achieved a 1 year quit rate of 28% among smokers who attended the smoking
cessation clinic.
•We are of the opinion that smokers who are older with no existing co-morbidities are
more likely to successfully quit smoking.


