Ageing and vulnerability in ASEAN countries, Eduardo Klien, Brunei
advertisement
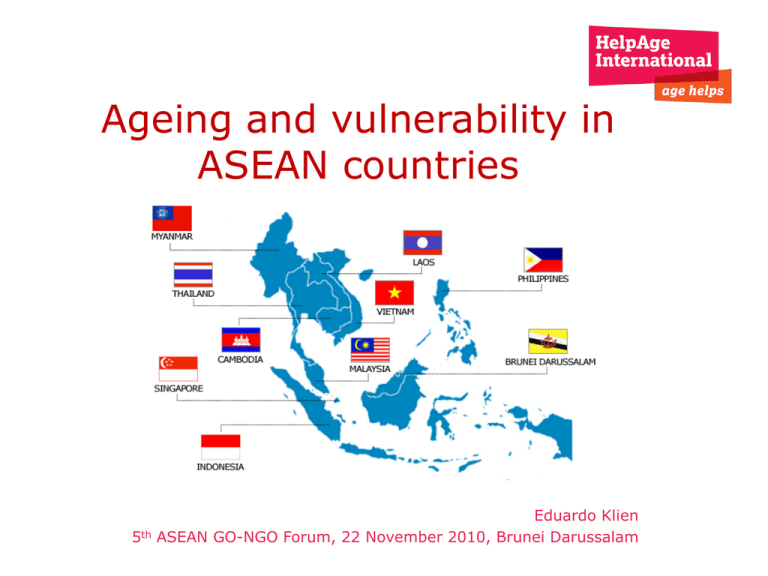
Ageing and vulnerability in ASEAN countries 5th Eduardo Klien ASEAN GO-NGO Forum, 22 November 2010, Brunei Darussalam Demographic Shift • Condensed in time • Irreversible in nature • Comprehensive in scope ASEAN population 80 60 14 Source: World Population Prospects: The 2008 Revision Population Database, United Nations Population Division http://esa.un.org/unpp/index.asp?panel=2) Compiled by HelpAge ASEAN population Source: World Population Prospects: The 2008 Revision Population Database, United Nations Population Division http://esa.un.org/unpp/index.asp?panel=2) Growth of the old and older old Population of OP (thousand) 200,000 180,000 30,777 160,000 140,000 120,000 80+ 100,000 60-79 80,000 147,624 60,000 40,000 20,000 55,381 25,608 0 1990 2015 2050 Source: World Population Prospects: The 2008 Revision Population Database, United Nations Population Division http://esa.un.org/unpp/index.asp?panel=2) Compiled by HelpAge Population ageing in ASEAN countries (%) Year 60+ 80+ male Female male Female 1990 45% 55% 39% 61% 2015 44% 56% 40% 60% 2050 44% 56% 37% 63% http://esa.un.org/unpp/p2k0data.asp • Reduction of proportion and absolute number of children • Increase of people over 60 years • Increase of older olds • Feminisation of old age Challenges on social and economic policy • How to ensure income security • How to provide adequate Health services • How to enhance Community care and inclusion Dependency ratios (Total, Child, Old-age) 2005 1985 Total Child Oldage Brunei 68 63 5 47 43 Cambodia 86 80 5 67 Indonesia 72 66 6 Lao PDR 91 84 Malaysia 74 Myanmar 2025 Total Child Oldage Total 5 41 30 11 51 28 23 62 5 52 44 8 46 31 15 51 43 8 43 30 13 56 27 29 7 78 72 6 56 49 7 48 34 14 67 6 56 49 7 48 35 13 53 28 25 78 70 8 50 42 8 46 33 13 55 28 27 Philippine s 82 76 6 65 59 6 53 43 10 51 32 19 Singapore 42 34 7 39 27 12 55 19 35 78 20 58 Thailand 63 56 7 43 33 10 48 29 19 60 28 32 Viet Nam 83 75 8 55 45 10 44 30 14 58 27 32 Compiled by HelpAge Total Child Oldage 2050 Child Oldage Dependency ratio in ASEAN 40% 37% 35% 30% 26% 25% 23% 20% 0-14 60+ 18% 15% 10% 10% 6% 5% 0% 1990' 2015' 2050' Source: World Population Prospects: The 2008 Revision Population Database, United Nations Population Division http://esa.un.org/unpp/index.asp?panel=2) Compiled by HelpAge Income security More consumption than income Income security • 21% of older people have formal pensions • Expansion of contributory pensions: limited option • Role of non-contributory pensions Life expectancy after 60 and years of ill health 30 male female Unhealthy Cambodia Laos 25 20 15 10 5 0 Vietnam Singapore Health Ageing and Non communicable diseases – 75% of the deaths in the region are attributable to NCDs compared to 14% of deaths from communicable diseases – NCDs represent 92% of the burden of disease (DALYs) in high income countries and 63% in middle and low income countries. Main NCDs of older people Adults Aged 60+ Rank 1 2 3 4 5 6 7 8 9 10 Diseases Ischaemic heart disease Cerebrovascular disease Chronic obstructive pulmonary disease Lower respiratory infections Trachea, bronchus, lung cancers Diabetes mellitus Hypertensive heart disease Stomach cancer Tuberculosis Colon and rectum cancers Source: WHO, 2006 Health • Rethink health systems to cover NCDs • Self-care approaches • Access to health services for older people (2 approaches to achieve universality) – Bismark: social insurance – Beveridge: tax funded free health care Care giving - Continuum of Care Nursing Home Cost of Care Home for the Aged Short Stay Day Care Paid Home Care Home Care Volunteer& family Community based care Source: HelpAge Korea Difficulties of ADL & IADL of OP Institutional care Community care and inclusion • Older people in work (family care) • Family and community care for older people • Inclusion and mainstreaming ageing • OPA development
