Food Staple Self-Sufficiency Program (FSSP)
advertisement
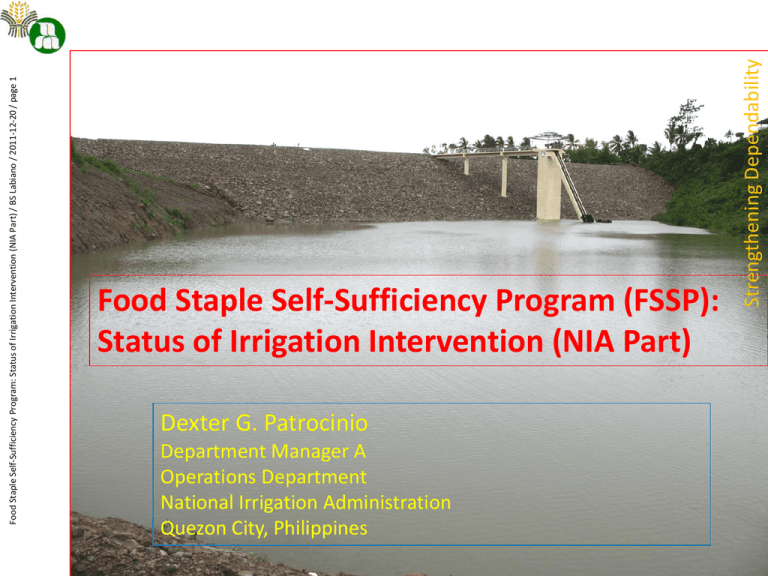
Dexter G. Patrocinio Department Manager A Operations Department National Irrigation Administration Quezon City, Philippines Strengthening Dependability Food Staple Self-Sufficiency Program: Status of Irrigation Intervention (NIA Part) / BS Labiano / 2011-12-20 / page 1 Food Staple Self-Sufficiency Program (FSSP): Status of Irrigation Intervention (NIA Part) Ensuring Productivity Food Staple Self-Sufficiency Program: Status of Irrigation Intervention (NIA Part) / BS Labiano / 2011-12-20 / page 2 A. Targeting Rice Self-Sufficiency Projected Rice Requirement Requirement = Total Utilization + Ending Stock for 90 days Milled Rice, Million mt 18.00 High Per Capita Consumption (119 kg/year) 17.50 17.59 17.26 16.93 17.00 16.61 16.50 16.00 16.86 16.30 16.54 15.99 16.23 Low Per Capita Consumption (113.57 kg/year) 15.92 15.50 15.00 15.62 15.33 2011 2012 2013 2014 2015 2016 Target Domestic Rice Supply Supply = Rice Equivalent of Production + Beginning Stocks Milled Rice, Million mt 19.0 18.5 18.0 17.5 17.0 16.5 16.0 15.5 15.0 14.45 14.5 14.0 14.12 13.5 2011 Target Supply 18.19 17.73 17.26 17.86 17.41 16.25 15.16 16.93 Projected Supply with Impacts of Climate Change 15.93 14.84 2012 2013 2014 2015 2016 Supply and Demand Milled Rice, Million mt Target Supply 19.0 18.5 Supply w/ ICC 18.0 17.5 17.0 Self-sufficiency by 2013 No imports by 2014 16.5 High Demand 16.0 Low Demand 15.5 15.0 14.5 14.0 13.5 2011 2012 2013 2014 2015 2016 Target Palay Production Palay, Million mt Target Production 24.0 22.73 23.0 22.13 22.0 21.50 22.23 21.63 21.0 20.04 21.00 20.0 19.0 18.46 19.54 Projected Production with ICC 18.0 17.0 16.0 16.96 17.96 16.46 15.0 2011 2012 2013 2014 2015 2016 Target Area Harvested All Ecosystems Million ha Irrigated Non-irrigated 6.00 5.00 4.49 4.58 4.00 4.74 4.85 4.94 5.02 3.75 3.83 3.50 3.65 3.16 3.27 1.33 1.31 1.24 1.20 1.19 1.19 2011 2012 2013 2014 2015 2016 3.00 2.00 1.00 0.00 Food Staple Self-Sufficiency Program: Status of Irrigation Intervention (NIA Part) / BS Labiano / 2011-12-20 / page 8 Food Staple Self-Sufficiency Program: Status of Irrigation Intervention (NIA Part) / BS Labiano / 2011-12-20 / page 9 Food Staple Self-Sufficiency Program: Status of Irrigation Intervention (NIA Part) / BS Labiano / 2011-12-20 / page 10 Food Staple Self-Sufficiency Program: Status of Irrigation Intervention (NIA Part) / BS Labiano / 2011-12-20 / page 11 Food Staple Self-Sufficiency Program: Status of Irrigation Intervention (NIA Part) / BS Labiano / 2011-12-20 / page 12 Food Staple Self-Sufficiency Program: Status of Irrigation Intervention (NIA Part) / BS Labiano / 2011-12-20 / page 13 Developing Infrastructure Food Staple Self-Sufficiency Program: Status of Irrigation Intervention (NIA Part) / BS Labiano / 2011-12-20 / page 14 B. Achieving Irrigation Quota Food Staple Self-Sufficiency Program: Status of Irrigation Intervention (NIA Part) / BS Labiano / 2011-12-20 / page 15 Food Staple Self-Sufficiency Program: Status of Irrigation Intervention (NIA Part) / BS Labiano / 2011-12-20 / page 16 Food Staple Self-Sufficiency Program: Status of Irrigation Intervention (NIA Part) / BS Labiano / 2011-12-20 / page 17 Food Staple Self-Sufficiency Program: Status of Irrigation Intervention (NIA Part) / BS Labiano / 2011-12-20 / page 18 Food Staple Self-Sufficiency Program: Status of Irrigation Intervention (NIA Part) / BS Labiano / 2011-12-20 / page 19 Food Staple Self-Sufficiency Program: Status of Irrigation Intervention (NIA Part) / BS Labiano / 2011-12-20 / page 20 Food Staple Self-Sufficiency Program: Status of Irrigation Intervention (NIA Part) / BS Labiano / 2011-12-20 / page 21 Food Staple Self-Sufficiency Program: Status of Irrigation Intervention (NIA Part) / BS Labiano / 2011-12-20 / page 22 Food Staple Self-Sufficiency Program: Status of Irrigation Intervention (NIA Part) / BS Labiano / 2011-12-20 / page 23 Surmounting Obstacles Food Staple Self-Sufficiency Program: Status of Irrigation Intervention (NIA Part) / BS Labiano / 2011-12-20 / page 24 C. Optimizing Irrigation Benefits Food Staple Self-Sufficiency Program: Status of Irrigation Intervention (NIA Part) / BS Labiano / 2011-12-20 / page 25 Food Staple Self-Sufficiency Program: Status of Irrigation Intervention (NIA Part) / BS Labiano / 2011-12-20 / page 26 Food Staple Self-Sufficiency Program: Status of Irrigation Intervention (NIA Part) / BS Labiano / 2011-12-20 / page 27 Food Staple Self-Sufficiency Program: Status of Irrigation Intervention (NIA Part) / BS Labiano / 2011-12-20 / page 28 Food Staple Self-Sufficiency Program: Status of Irrigation Intervention (NIA Part) / BS Labiano / 2011-12-20 / page 29 Food Staple Self-Sufficiency Program: Status of Irrigation Intervention (NIA Part) / BS Labiano / 2011-12-20 / page 30 Food Staple Self-Sufficiency Program: Status of Irrigation Intervention (NIA Part) / BS Labiano / 2011-12-20 / page 31 Food Staple Self-Sufficiency Program: Status of Irrigation Intervention (NIA Part) / BS Labiano / 2011-12-20 / page 32 Pump-Priming Growth D. Expediting Project Execution Food Staple Self-Sufficiency Program: Status of Irrigation Intervention (NIA Part) / BS Labiano / 2011-12-20 / page 33 Food Staple Self-Sufficiency Program: Status of Irrigation Intervention (NIA Part) / BS Labiano / 2011-12-20 / page 34 Food Staple Self-Sufficiency Program: Status of Irrigation Intervention (NIA Part) / BS Labiano / 2011-12-20 / page 35 Tackling Constraints Food Staple Self-Sufficiency Program: Status of Irrigation Intervention (NIA Part) / BS Labiano / 2011-12-20 / page 36 E. Enhancing Irrigation Performance Food Staple Self-Sufficiency Program: Status of Irrigation Intervention (NIA Part) / BS Labiano / 2011-12-20 / page 37 NIA’s Quota in FSSP Particulars Beginning Area, ha Generated Area, ha Restored Area, ha Rehabilitated Area, ha Ending Area, ha Cropping Intensity, % Harvested Area, ha Increment Harvested Area, ha 2010 2011 2013 1,483,140 1,536,135 1,577,607 1,676,790 7,106 21,910 52,398 26,532 45,889 19,562 46,784 23,689 149,495 46,084 47,328 50,304 1,536,135 1,577,607 1,676,790 1,727,011 1.40 1.44 1.47 1.50 2,076,396 2,212,034 2,319,080 2,515,180 0 135,638 107,050 196,100 3.16 3.27 3.50 428,616 350,054 686,350 12.79 25.00 15.00 Irrigated Crop Yield, mt/ha Increment Palay Production, mt Budget, B P 2012 13.60 n.b. Excerpts from the FSSP 07 Dec. 2011 version NIA’s Targets in Budget Strategy (BS) Particulars Beginning Area, ha Generated Area, ha Restored Area, ha Rehabilitated Area, ha Ending Area, ha 2010 2013 1,536,135 1,581,955 1,685,935 7,106 23,510 65,180 57,560 45,889 22,310 38,800 34,260 149,495 144,730 29,100 25,700 1,536,135 1,581,955 1,685,935 1,777,755 1.40 1.44 1.47 1.50 2,076,396 2,212,034 2,325,474 2,528,902 0 135,638 113,440 203,428 3.16 3.27 3.50 428,616 370,949 711,998 14.03 24.67 22.00 Increment Harvested Area, ha Irrigated Crop Yield, mt/ha Increment Palay Production, mt Budget, B P 2012 1,483,140 Cropping Intensity, % Harvested Area, ha 2011 13.60 n.b. Excerpts from the NIA Budget Strategy NIA’s Accomplishments in 2011 Particulars FSSP BS Achieved 1,536,135 1,536,135 1,536,135 Generated Area, ha 21,910 23,510 20,926a 96%b Restored Area, ha 19,562 22,310 28,317 144% Rehabilitated Area, ha 46,084 144,730 131,102 284% 1,577,607 1,581,955 1,585,378 1.44 1.44 1.44 2,212,034 2,212,034 2,212,034 135,638 135,638 135,638 3.16 3.16 3.16 428,616 428,616 428,616 12.79 14.03 24.67 Beginning Area, ha Ending Area, ha Cropping Intensity, % Harvested Area, ha Increment Harvested Area, ha Irrigated Crop Yield, mt/ha Increment Palay Production, mt Budget, B P n.b. a Includes carryover accomplishments in 2011 of 2010 targets b Based on the FSSP targets NIA’s Accomplishments in 2012 Particulars FSSP BS Achieved 1,577,607 1,581,955 1,585,378 Generated Area, ha 52,398 65,180 16,466a 31%b Restored Area, ha 46,784 38,800 14,741 32% Rehabilitated Area, ha 47,328 29,100 48,121 102% 1,676,790 1,685,935 ~ 1.47 1.47 1.47 2,319,080 2,325,474 2,330,506 107,050 113,440 118,472 3.27 3.27 3.27 350,054 370,949 387,403 25.00 24.67 24.67 Beginning Area, ha Ending Area, ha Cropping Intensity, % Harvested Area, ha Increment Harvested Area, ha Irrigated Crop Yield, mt/ha Increment Palay Production, mt Budget, B P n.b. a Includes carryover accomplishments in 2012 of 2011 targets (end of 2nd qtr 2012) b Based on the FSSP targets Major Facts Reiterated NIA’s quota in FSSP is lifted from the 07 December 2011 program document, which remains valid to date NIA’s targets in the BS are made higher that the FSSP quota , which intends to achieve the FSSP quota NIA’s 2011 accomplishments in terms of rolled-out irrigation areas are in general achieving the FSSP quota NIA’s 2012 accomplishments in terms of incremental harvested area and crop production achieve the FSSP quota Computation of benefits (e.g. incremental harvested area) applies FSSP data on CI and CY, to dispel bias Accomplishments in terms of incremental harvested area and crop production exceed the FSSP and BS targets

