International Economics and Business

Beugelsdijk, Brakman, Garretsen, and van Marrewijk
© Cambridge University Press, 2013
International Economics and Business
Chapter 2 – Getting the numbers right
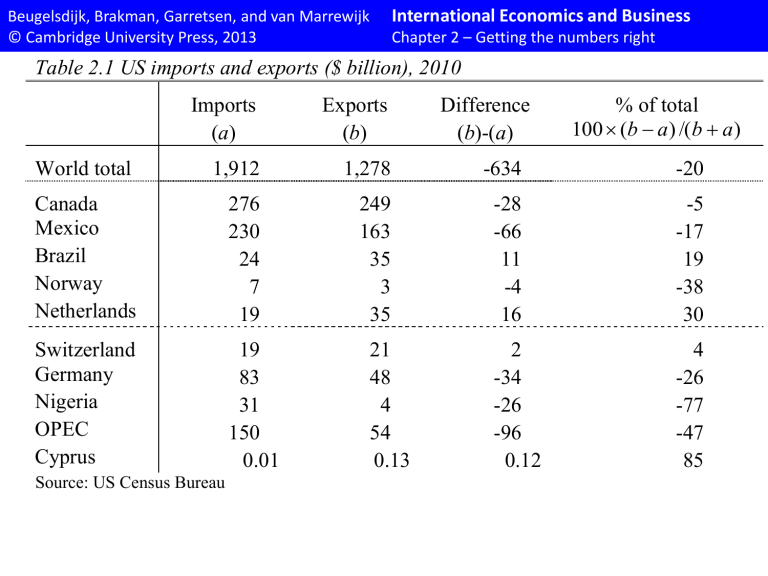
Table 2.1 US imports and exports ($ billion), 2010
100
% of total
(
b
a
) /(
b
a
)
Imports
(
a
)
Exports
(
b
)
World total 1,912 1,278
Canada
Mexico
276 249
230 163
Brazil 24 35
Norway 7 3
Netherlands 19 35
Difference
(
b
)-(
a
)
-634
-28
-66
11
-4
16
Switzerland 19 21
Germany 83 48
Nigeria 31 4
2
-34
-26
OPEC 150 54 -96
Cyprus 0.01 0.13 0.12
Source: US Census Bureau
-20
-5
-17
19
-38
30
4
-26
-77
-47
85
Beugelsdijk, Brakman, Garretsen, and van Marrewijk
© Cambridge University Press, 2013
Table 2.2 A firm’s statement of income
1
International Economics and Business
Chapter 2 – Getting the numbers right
Revenue
Cost of sales
Gross profit
Selling, administrative, and other expenses
Research and development
Other income
Other expenses
Operating profit
Interest income
Interest expenses
Currency exchange gains or losses
Income before taxation
Taxation
Minority interests
Income after taxation
Income from discontinued operation (net of taxes)
Income on disposal of discontinued operations (net of taxes)
Cumulative effects of changes in accounting principles
Net income
1
Neither the terminology nor the complete set-up need be similar across countries, firms and periods. For example, gross profit is often referred to as gross margin, and many firms list special items (such as merger or reorganization costs). In this table we list a “common denominator”.
Beugelsdijk, Brakman, Garretsen, and van Marrewijk
© Cambridge University Press, 2013
Table 2.3 Funding options for multinationals
International Economics and Business
Chapter 2 – Getting the numbers right
Location Internal
Source
External
Parent country Retained earning of the multinational parent
Local (host country) Retained earnings of local subsidiary
Equity or debt raised by the multinational parent
Equity or debt raised by multinational parent or by local subsidiary
Third country Retained earnings of the third country based subsidiary
Equity or debt raised by multinational parent or by 3 rd country based subsidiary
Source: Root (1994, p. 584); the shaded box is excluded in FDI statistics.
Beugelsdijk, Brakman, Garretsen, and van Marrewijk
© Cambridge University Press, 2013
Table 2.4 Inward FDI stock; US $ bn, 2009
International Economics and Business
Chapter 2 – Getting the numbers right a. USA inward FDI stock
Total 2,253
United Kingdom
Japan
Netherlands
Canada
Germany
Switzerland
France
Luxembourg
Australia
Spain
454
264
238
226
218
189
189
128
46
44
% b. Germany inward FDI stock
Total
20.1 Netherlands
11.7 Luxembourg
10.6 United States
10.0 France
9.7 Switzerland
8.4 United Kingdom
8.4 Italy
5.7 Austria
2.0 Japan
1.9 Sweden
909
230
127
98
96
75
73
47
25
20
18
%
25.3
14.0
10.7
10.5
8.2
8.1
5.1
2.8
2.2
2.0
Beugelsdijk, Brakman, Garretsen, and van Marrewijk
© Cambridge University Press, 2013
International Economics and Business
Chapter 2 – Getting the numbers right c. Japan inward FDI stock
Total 189 % d. Australia inward FDI stock
Total 224 %
United States
Netherlands
Cayman Islands
France
Singapore
United Kingdom
Germany
Switzerland
75
36
17
15
11
7
7
5
39.7
19.1
9.0
8.0
5.6
3.9
3.8
2.6
United States
United Kingdom
Japan
Netherlands
Switzerland
Germany
France
Canada
66
42
25
17
14
10
9
7
Luxembourg
Hong Kong
4
3
2.3
1.4
Singapore
Hong Kong
7
7
3.1
2.9
Source: OECD Foreign Direct Investment Position database; German and Australian data for 2008.
29.5
18.6
11.1
7.7
6.0
4.2
4.1
3.1
Beugelsdijk, Brakman, Garretsen, and van Marrewijk
© Cambridge University Press, 2013
International Economics and Business
Chapter 2 – Getting the numbers right
Table 2.5 Foreign Direct Investment (FDI), stocks and flows; $ bn (%), 2011
World
Flows
1,524
(100)
FDI in
Stock
20,438
(100)
Flows
FDI out
Stock
1,694
(100)
21,168
(100)
Developed economies
Europe
North America
Other developed ec.
Developing economies
748
(49.1)
425
(27.9)
268
(17.6)
55
(3.6)
684
(44.9)
13,056
(63.9)
8,081
(39.5)
4,104
(20.1)
870
(4.3)
6,625
(32.4)
1,238
(73.0)
651
(38.4)
446
(26.3)
140
(8.3)
384
(22.6)
Africa
Asia
43
(2.8)
423
(27.8)
570
(2.8)
3,991
(19.5)
4
(0.2)
280
(16.6)
126
(0.6)
2,573
(12.2)
Latin America
Oceania
217
(14.2)
2
(0.1)
2,048
(10.0)
17
(0.1)
10
(0.6)
0
(0.0)
1,006
(4.8)
1
(0.0)
Source: based on data from UNCTAD (2012), World Investment Report 2012; % in parentheses.
17,056
(80.6)
10,444
(49.3)
5,170
(24.4)
1,442
(6.8)
3,705
(17.5)
Beugelsdijk, Brakman, Garretsen, and van Marrewijk
© Cambridge University Press, 2013
International Economics and Business
Chapter 2 – Getting the numbers right
Table 2.6 Analytic presentation: balance of payments, 2007 (billion US dollars)
A current account goods: exports fob goods: imports fob balance on goods services: credit services: debit balance on goods and services income: credit income: debit balance on goods, services, and income current transfers: credit current transfers: debit
B capital account capital account: credit capital account: debit total: groups A plus B
C financial account direct investment abroad direct investment in Germany/USA portfolio investment assets portfolio investment liabilities financial derivatives other investment assets other investment liabilities total: groups A through C
D net errors and omissions total: groups A through D
E reserves and related items overall balance
Source IMF Balance of Payments Statistics Yearbook
Germany
255.53
1,354.12
-1,075.43
278.69
214.96
-254.23
239.41
318.01
-260.12
297.31
25.43
-67.21
.24
4.75
-4.51
255.77
-301.46
-169.37
50.94
-178.42
370.43
..
-440.27
164.39
-45.69
46.93
1.24
-1.23
0.00
USA
-731.21
1,152.57
-1,967.87
-815.30
493.16
-378.11
-700.26
817.78
-736.03
-618.50
22.33
-135.03
-1.84
1.8
-3.65
-733.05
774.47
-333.27
237.54
-294.57
1,145.14
..
-661.89
675.02
41.42
-41.29
0.13
-0.13
0.00
Beugelsdijk, Brakman, Garretsen, and van Marrewijk
© Cambridge University Press, 2013
International Economics and Business
Chapter 2 – Getting the numbers right
Table 2.7 FDI inflows and outflows, as % of total flows
Period
Developed economies Developing economies Transition economies
In Out In Out In Out
1980-89
1990-99
74.7
68.1
2000-09
Source: UNCTAD
65.1
94.0
88.0
85.0
25.3
30.8
31.3
6.0
11.7
13.2
0.0
1.0
3.9
0.0
0.4
1.8
Beugelsdijk, Brakman, Garretsen, and van Marrewijk
© Cambridge University Press, 2013
International Economics and Business
Chapter 2 – Getting the numbers right
Table 2.8: U.S. outward multinational activity in 2010
Ranking FDI Affiliate sales Affiliate value added
5
6
7
8
1
2
3
4
Netherlands
United Kingdom
Canada
Luxemburg
Bermuda
Ireland
UK Island, Caribbean
Switzerland
United Kingdom
Canada
Germany
Singapore
Switzerland
Ireland
Japan
Netherlands
United Kingdom
Canada
Germany
Japan
France
Ireland
Australia
Brazil
9
10
Australia
Japan
France
Mexico
Switzerland
China
Source: BEA. The value added and sales data refer to majority owned all foreign affiliates in 2009. The
FDI data reflect the direct investment position in 2010 based on a historical costs basis.
Beugelsdijk, Brakman, Garretsen, and van Marrewijk
© Cambridge University Press, 2013
International Economics and Business
Chapter 2 – Getting the numbers right
Table 2.9 Top 10 non-financial multinationals 2011, ranked according to TNI
4
5
6
2
3
7
Rank Corporation
1 Nestlé SA
Anglo American plc
Xstrata PLC
Anheuser-Busch InBev NV
Nokia OYJ
ABB Ltd.
Home country
Switzerland
UK
Switzerland
Belgium
British American Tobacco PLC UK
Finland
Switzerland
Sector
Food, beverages and tobacco
Mining & quarrying
Mining & quarrying
Engineering services
8
9
ArcelorMittal
Linde AG
Luxembourg
Germany
Metal and metal products
Chemicals
10 Vodafone Group Plc UK Telecommunications
Source: UNCTAD World Investment Report 2012; * TNI = TransNationality Index
TNI
*
96.9
93.9
93.5
Food, beverages and tobacco
Food, beverages and tobacco
92.4
91.7
Electrical & electronic equipment 91.4
91.2
90.5
90.2
90.2
Beugelsdijk, Brakman, Garretsen, and van Marrewijk
© Cambridge University Press, 2013
International Economics and Business
Chapter 2 – Getting the numbers right
Table 2.10: Country of origin of Global 500 between 2005-2010
Country
United States
Japan
France
Germany
Britain
China
Netherlands
Canada
BRIC total
Other
Total
2005
176
81
39
37
35
16
14
13
27
78
500
2006
170
70
38
38
35
20
14
14
35
86
500
2007
162
67
38
37
33
24
14
16
39
94
500
2008
153
64
39
37
34
29
13
14
46
100
500
2009
140
68
40
39
26
37
12
14
58
103
500
2010
139
71
39
37
29
46
13
11
67
94
500
Beugelsdijk, Brakman, Garretsen, and van Marrewijk
© Cambridge University Press, 2013
International Economics and Business
Chapter 2 – Getting the numbers right
Table 2.11: GDP, sales and profits in 2009 (in US$ bn)
Country GDP
Sweden: 406
Honduras: 14.3
Firm sales
Walmart (1): 408
Dai Nippon Printing (500): 17
Firm profits
Walmart (1): 14.3
Dai Nippon Printing (500): 0.3
Beugelsdijk, Brakman, Garretsen, and van Marrewijk
© Cambridge University Press, 2013
International Economics and Business
Chapter 2 – Getting the numbers right
Table 2.12 Size of net capital flows; selected countries, 1870-2010
Period Arg Aus Can Fr Ger It Jap UK USA
1870-1889 18.7 9.7 7.2 2.9 1.9 1.8 0.5 4.5 1.5
1890-1913 6.2 6.3 7.6 2.3 1.4 1.9 2.2 4.5 0.8
1914-1918 2.7 7.6 3.5 3.1 - 11.7 6.6 2.9 3.5
1919-1926 4.9 8.8 2.3 1.1 2.2 4.2 2.1 2.9 1.7
1927-1931 3.7 12.8 3.6 1.8 1.8 1.5 0.6 2.0 0.8
1932-1939 1.6 3.7 1.6 3.7 0.4 0.7 1.1 1.1 0.6
1940-1946 4.8 7.1 6.5 1.8 - 3.4 1.0 7.3 1.0
1947-1959 3.1 3.4 2.3 2.0 2.0 1.4 1.3 1.2 0.6
1960-1973 1.0 2.3 1.2 1.5 1.0 2.1 1.0 0.8 0.5
1974-1989 1.7 3.7 2.6 0.8 1.9 1.4 2.0 1.4 1.3
1990-2000 2.9 4.5 2.3 1.1 1.3 1.9 2.3 1.9 1.8
2001-2010 3.3 4.9 1.8 1.1 4.6 1.8 3.4 2.3 4.6
Source: Obstfeld (1998), update Obstfeld and Taylor (2004), Table 2.2. Updated for the period 2001-2010 using World Bank Development Indicators data. Size of net capital flows measured as mean absolute value of current account as a percentage of GDP, annual data; - = data not available; Arg = Argentina,
Aus = Australia, Can = Canada; Fr = France, Ger = Germany It = Italy, Jap = Japan, UK = United
Kingdom, and USA = United States of America.
Beugelsdijk, Brakman, Garretsen, and van Marrewijk
© Cambridge University Press, 2013
International Economics and Business
Chapter 2 – Getting the numbers right
Table 2.13 Gross financial stocks, ratios and shares
1825 1855 1870 1900 1914 1930 1938
Assets / GDP
Liabilities / GDP
-
-
-
-
0.07 0.19 0.18 0.08 0.11
- 0.14 0.21 - 0.11
Foreign assets: UK share 0.56 0.78 0.64 0.51 0.50 0.44 0.43
Foreign assets: US share 0.00 0.00 0.00 0.02 0.06 0.36 0.22
1945 1960 1980 1985 1990 1995 2000
Assets / GDP
Liabilities / GDP
0.05 0.06 0.25 0.36 0.49 0.62 0.92
- 0.02 0.30 - 0.60 0.79 0.95
Foreign assets: UK share 0.40 0.21 0.20 0.19 0.17 0.16 0.15
Foreign assets: US share 0.43 0.51 0.28 0.29 0.21 0.22 0.25
Source: Obstfeld and Taylor (2004, pp. 52-53); - = data not available; Sample size increases from 7 in
1900 to 63 in 2000.
Beugelsdijk, Brakman, Garretsen, and van Marrewijk
© Cambridge University Press, 2013
Table 2A.1 Overview of tax havens:
International Economics and Business
Chapter 2 – Getting the numbers right
The Caribbean and
Americas
Anguilla
Antigua and Barbados
Aruba the Bahamas
Barbados
Belize
Bermuda
British Virgin Islands
Costa Rica
Domini
Grenada
Montserrat
Netherlands Antilles
New York
Africa
Liberia
Mauritius
Melila the Seychelles
Soa Tome e Principe
Somalia
South Africa
Middle East and Asia
Bahrain
Dubai
Hong Kong
Labuan
Lebanon
Macau
Europe
Aldernay
Andorra
Belgium
Campione d'Italia
City of London
Cyprus
Gibraltar
Guernsey
Hungary
Iceland
Ireland (Dublin)
Ingushetia
Isle of Man
Jersey
Liechtenstein
Panama
Saint Lucia
St. Kitts & Nevis
Saint Vincent and the
Grenadines
Turks and Calcos Islands
Uruguay
US Virgin Islands
Singapore
Tel Aviv
Taipei
Indian and Pacific Ocean
The Cook Islands
The Maladives
The Marianas
Luxembourg
Madeira
Malta
Monaco
Netherlands
Sark
Switzerland
Trieste
Marshall Islands
Nauru
Niue
Samoa
Tonga
Turkish Republic of Nothern
Cyprus
Frankfurt
Vanuatu
Source: offshore business magazine (20 Sep 2006, pp. 66-7) and Tax Justice network "tax us if you can".
Beugelsdijk, Brakman, Garretsen, and van Marrewijk
© Cambridge University Press, 2013
International Economics and Business
Chapter 2 – Getting the numbers right
Table 2A.2 Global 500: Top 20 largest firms of the world; in US $ bn,,2010
Rank Company Country
1
2
3
4
5
Wal-Mart Stores
Royal Dutch Shell
Exxon Mobil
BP
Toyota Motor
U.S.
Netherlands
U.S.
Britain
Japan
6
7
8
9
Japan Post Holdings
Sinopec
State Grid
AXA
Japan
China
China
France
10 China National Petroleum China
11 Chevron
12 ING Group
13 General Electric
14 Total
15 Bank of America Corp.
U.S.
Netherlands
U.S.
France
U.S.
16 Volkswagen
17 ConocoPhillips
18 BNP Paribas
19 Assicurazioni Generali
20 Allianz
Source: Fortune Global 500
Germany
U.S.
France
Italy
Germany
Revenues
408
285
285
246
204
202
188
184
175
165
164
163
157
156
150
146
140
131
126
126
Profits
14.3
12.5
19.3
16.6
2.3
4.8
5.8
-0.3
5.0
10.3
10.5
-1.3
11.0
11.7
6.3
1.3
4.9
8.1
1.8
6.0


