IRPTN Hearings - Mbombela
advertisement
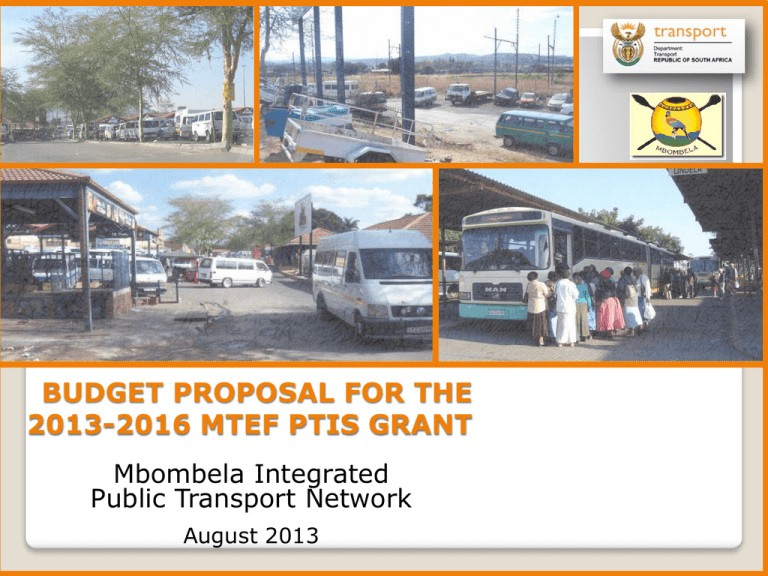
BUDGET PROPOSAL FOR THE 2013-2016 MTEF PTIS GRANT Mbombela Integrated Public Transport Network August 2013 Mobility response to integrated development plans IPTN responds to spatial development plans, eradicating the dysfunctional spatial system – integration of communities White RiverNelspruit development corridor – employment growth Nsikazi Corridor Commuter linkages along with emerging Business nodes Lehawu Mataffin precinct Linking corridors development along transport routes R536 R536 Transfer Ranks (Residential) HAZYVIEW Business Node Rank Line-haul Routes Feeder Routes PT Priority Routes SWALALA R538 WHITE RIVER KABOKWENI D2689 ROCKY DRIFT LEHAWU R40 723 D1 RIVERSIDE D2296 KANYAMAZANE N4 LEKAZI NELSPRUIT MATSULU ROUTES • 1 priority route – 21kms • 4 line-haul routes: 191kms • 5 Feeder routes groups: 656 kms • 1 City Res /CBD dist. route - 106kms RANKS & STATIONS • 1 Central transfer station: Nelspruit hub • 5 Transfer ranks: Swalala, Kabokweni, Lehawu, Lekazi, Matsulu, plus Barberton linkage • 3 Business node stations: White-river, Riverside, Hazyview KAAPMUIDEN Phase Description Timing Phase 0: (Pilot phase) To test and bed down processes and ITS systems Problem resolution / correction thereafter July 2015 Aug. 2015 Oct. 2015 Phase 1 Southern routes: • Matsulu (1a) & Lekazi (1b) Nov. 2015 Jan. 2016 Phase 2 Central (a & b): •Kabokweni (2b) & Lehawu (2a) •CBD distribution (2c) •Residential distribution (2c) Jan. 2016 March 2016 Phase 3 Northern routes: •Hazyview (3a), Swalala (3b), White River •Priority route (Nelspruit/White River) (3c) April 2016 June 2016 R536 R536 Transfer Ranks (Residential) HAZYVIEW Business Node Rank Line-haul Routes Feeder Routes PT Priority Routes SWALALA R538 Pilot phase: Test to beddown the ITS systems Phase 1: Southern routes Phase 2: Central (a& b), CBD and residential distribution (c) Phase 3: Northern routes, including White River – Nelspruit priority route WHITE RIVER KABOKWENI D2689 ROCKY DRIFT LEHAWU R40 3 72 D1 RIVERSIDE D2296 2, c KANYAMAZANE N4 LEKAZI NELSPRUIT MATSULU KAAPMUIDEN 2013 am commuter passengers (estimated) Route Origin LH 001 LH 002 LH 003 LH 004 LH 005 LH 006 LH 007 LH 008 Swalala/Masoyi Swalala/Masoyi Kabokweni Kabokweni Lehawu Lekazi Matsulu Barberton Route Am peak Total per Total per Destination length bus day day MBTs' (kms) passengers (BUSCOR) caluclated TOTAL (Bus & MBT) Nelspruit White River Nelspruit White river Nelspruit Nelspruit Nelspruit Nelspruit Total 14942 17847 18651 19487 40279 33226 18337 1638 164407 41 19 29 15 24 23 40 44 235 6184 7569 7970 8328 17213 14199 7836 700 69300 12369 15137 15941 16655 34427 28399 15673 1400 140000 2573 2710 2710 2831 5853 4828 2664 238 24407 2013 estimates not based on/or verified by the CPTR, as this information has not be availed to the project team 2013 Passengers per peak hour Bus MBT Route passengers passengers Route Origin Destination length for am for am (kms) peak hour peak hour LH 001 Swalala/Masoyi Nelspruit 41 3711 631 LH 002 Swalala/Masoyi White River 19 4541 772 LH 003 Kabokweni Nelspruit 29 4782 813 LH 004 Kabokweni White river 15 4997 849 LH 005 Lehawu Nelspruit 24 10328 1756 LH 006 Lekazi Nelspruit 23 8520 1448 LH 007 Matsulu Nelspruit 40 4702 799 LH 008 Barberton Nelspruit 44 420 71 Total 235 42000 7140 TOTAL passenger per peak hour 4341 5313 5595 5846 12084 9968 5501 491 49140 Assumptions: Morning commuter peak over 2 hours, with 60% in peak hour (7am) interchange turn-over rate rates 15 minutes per bay pet bus Feeder routes Area origin Feeder A Feeder B Feeder C Feeder D Feeder E Feeder F Swalala/Masoyi Kabokweni Lehawu Lekazi Matsulu Barberton Total Ave route length (kms) 17 15 4 8 3 15 62 Am peak passengers at tranfer ranks 13998 16075 10426 6698 7836 700 69300 Feeder services Walk in 11199 12860 8341 5358 6269 560 44587 2800 3215 2085 1340 1567 140 11147 Key assumptions: • Average speed 25kms/h; Interchange turn-over rates, Bus 15min & MBT 5 min Headways in peak: Busses 5-10 min; Midi MBTs 2-5 min Provisional estimated vehicle requirements Route Origin LH 001 LH 002 LH 003 LH 004 LH 005 LH 006 LH 007 LH 008 Swalala/Masoyi Swalala/Masoyi Kabokweni Kabokweni Lehawu Lekazi Matsulu Barberton Articulate Small Destination d busses busses 114/138) (48) Nelspruit White River Nelspruit White river Nelspruit Nelspruit Nelspruit Nelspruit Total 20 24 25 26 54 45 25 2 221 6 7 8 8 17 14 8 1 68 Midi/MBT busses (16/24) 10 12 13 14 28 23 13 1 115 Feeder route vehicle requirements Midi bus Small bus Small bus & MBT Midi/MBT Area origin (94) trips nos. (ave) 18 nos. trips Feeder A Swalala/Masoyi 71 24 249 62 Feeder B Kabokweni 82 27 286 71 Feeder C Lehawu 53 18 185 46 Feeder D Lekazi 34 11 119 30 Feeder E Matsulu 40 13 139 35 Feeder F Barberton 0 0 31 8 Total 281 94 1009 252 Existing Bus (art) Existing Taxi Proposed Art. bus Proposed small, midi bus Uni-directional routes 206 54 24 106 Pass-km per peak hr 1 100 000 200 000 1 000 000 300 000 30% < 1/hr - 100% > 10/hr 3 to 35/hr 1st wait time average 8.2 min - - < 5 min Transfer wait time average 6.0 min - 5.0 min - 20% - 0% 0% Bus frequency Standees Average in Vehicle Time 16 14 12 10 8 6 4 2 0 50 40 30 20 10 0 Walk Total Wait 1st Wait Connection Per Xfer Passenger-km (pk-hr) Pass-km x 1000 60 Minutes Minutes Average Connection Time Trip 1,400,000 1,200,000 1,000,000 800,000 600,000 400,000 200,000 0 Total Taxi Mode Bus BUS PASSENGERS V. HEADWAYS Thousand Passengers 14000 12000 10000 8000 6000 4000 2000 0 60 30 20 15 12 10 5 - 10 3-5 Minutes Headw ay 2-3 <2 Existing Planned Thousand Passengers TAXI PASSENGERS V. HEADWAYS 10000 9000 8000 7000 6000 5000 4000 3000 2000 1000 0 60 30 20 15 12 10 5 - 10 Minutes Headw ay 3-5 2-3 <2 Existing Planned R536 R536 Transfer Ranks (Residential) 4 corridor contracts (line-haul) HAZYVIEW Business Node Rank Line-haul Routes Swalala feeders (Northern) Feeder Routes PT Priority Routes 4 Feeder area contracts SWALALA R538 Kabokweni feeders (Central) WHITE RIVER KABOKWENI D2689 ROCKY DRIFT Residential distribution RIVERSIDE LEHAWU R40 3 72 D1 D2296 KANYAMAZANE Barberton NELSPRUIT corridor (Western) 1 residential distribution contract, incl. CBD N4 LEKAZI Lekazi/Matsulu feeders (Southern) MATSULU 19 KAAPMUIDEN Step 1 • Confirm status quo and future public transport requirements Step 2 • Bilateral consultations with and between spheres of government Step 3 • Establish and convene Intergovernmental Forum Step 4 • Conduct “Section 78” type investigation (to extent required) Step 5 • Consider institutional options (evaluate against agreed criteria) Step 6 • Agreement on structures and assignment of functions Step 7 • Implementation of structures and assigned functions Dependant on effective MPG participation Process been frustrated by non-participation of MPG: ◦ Drafted MoU incorporating MPG comments signed off by Municipal Manager awaiting signature of HOD of MPG Dept of Transport ◦ Drafted Inter governmental agreement prepared for discussion and acceptance by proposed Inter governmental Forum as soon as MoU signed ◦ Tabled working document to MPG on proposed institutional structures and responsibilities developed for further discussion between parties ◦ Obtained legal opinion of Ministerial Intervention “Letter of ministerial Intervention in terms of NLTA” Development of transport entity being pursued regardless of MPG participation IPTN unit and organisational development: ◦ Establish functional IPTN Unit (Entity) Establish division (IPTN unit) under PMU within municipality Develop detailed organisational design, grading and job descriptions Develop resourcing plan, with consideration for existing capacities Mobilisation and contracting: ◦ Recruitment: Advertising of posts Evaluation and selection ◦ Employment: Appointment and contracting Induction, and training Deployment IPTN Unit within MLM, precursor to formation of a ring-fenced Municipal Entity Tasks Sub tasks Timing Planning •Conceptual model •Agreement on entity type •Functional resourcing model •Transitional arrangements •Organisational design •Job descriptions & grading •Existing capacity & resourcing Jan 2013 Oct 2013 Sept 2013 Sept 2013 Oct 2013 Oct 2013 Nov 2013 Mobilisation •Migration process (existing staff) Nov 2013 •Advertising, recruitment & selection Jan 2013 Implementation •Employment contracts •Induction & training •Deployment of staff Feb 2013 March 2013 April 2013 General Manager Risk management Industry transition Communication / Public Relations Office support Business development Facilities development Operations Administration Industry development Stakeholder communication Institutional development Route (upgrades) Fleet services Human Resources Capacity building Public awareness IRT technology Depots & hubs IT Systems (control centre) Finance Operational planning Interchanges & stations Facility management General Admin. Business planning Signals & signage Client services Training & mentoring Marketing Promotion Call Centre This function ideally to be ring-fenced from the core project to ensure no conflict of interest Contracting These functions could be outsourced Information Technology General Manager Risk management Communication / Client Services Operations Office support Finance IT Systems Administration Client liaison Fleet services (Operator) Grant compliance Fare management Human Resources Public relations Facility operations Budgeting & monitoring Scheduling & monitoring General Admin. Risk management Procurement & payments Ticketing & collections Finance Monitoring & inspections Asset management Business support Marketing Promotion Call Centre Contracts Control center These functions could be outsourced Entity functional requirements: Core contract management function General manager (TMU) Secretary /PA Reception & switchboard Contract management: Contract manager(s); Assistants Monitors Resourcing requirement 1 1 1 2 2 (5) Total 7 (12) Resourcing capacity required to manage and monitor public transport contracting function Entity functional requirements: Supportive functions Client services: Public relations officer Industry transition Business development Infrastructure development General administration General clerk Resourcing requirement 1 1 1 2 Total 1 6 Resourcing required for the support, business development and industry transitional functions Programme DETAILS (RAND ‘000, OR %, OR OTHER PTISG funds received in 2012/2013 R 98 703 000,00 Expenditure to date up to 30 June 2013 R54 494 887.91 Balance of funds at 30 June 2013 R 44 208 112,09 % of 2012-13 Grant spent up to 30 June 2013 55% Rollover request for 2012/13 (i.e. transferred funds that have not been spent) R44 208 112.09 Reasons for under-expenditure Late confirmation of allocated funds delayed contract appointments Actions to ameliorate under-spending R 44 208 112,09 roll-over amount will be spent on the 1st & 2nd quarter of 2013/14 Project Project Value Planned Expenditure (2013/14) PTAP Planning R 36 350 040.00 R 12 754 790.59 R40 Northern Section R 59 000 000.00 R 37 189 903.47 R40 Central Section R 34 000 000.00 R 19 635 128.66 R40 Southern Section R 53 500 000.00 R 52 255 419.08 Nelspruit PT Rank R 54 000 000.00 R 39 684 895.61 Central PT Priority Lanes R 55 000 000.00 R 4 283 891.14 Rocky Drift R 10 000 000.00 R 9 955 702.63 Kanyamazane R 43 499 550.00 R 3 343 513.78 Matsulu R 27 475 995.00 R 2 191 362.95 Total R372 825 585.00 R 181 294 607.90 Late approval of infrastructure spend: Impasse with Mpumalanga Provincial Government ◦ Permission to spend allocation on infrastructure in November 2012 ◦ Inability to conclude the Memorandum of Understanding No structure and/or protocol for engagement ◦ Retarding progressing of institutional arrangements: Inability to attain agreement on the conceptual functional structures Not providing access to information critical to enable the development of an organisational structure and developing the staff migration plan ◦ Inability to complete the due diligence process and gain access to base information: Not providing access to existing public transport service providers Not providing access to the detailed transport record, contracting information and costing information Addressing impasse with MPG: ◦ Continued efforts to solicit participation: Endeavours to conclude MoU Agreement to participation on joint PTIS team Appeals to NDoT for continued support Prioritising key work elements: ◦ Establishment of a transport unit within MLM ◦ Continued prioritisation of key infrastructure projects ◦ Activation of communication activity Progressing regardless with planning and formation of a transport unit Outcomes, milestones and targets achieved Plans:1. Due diligence (update) 2. Business Plan 3. Operational Plan 4. Communications Plan 5. Industry Transition Planning 6. Institutional Plan 7. Operating System 8. Consolidated Financial Plan 9. ITS (Concept) 10. Infrastructure Planning 11. NMT Integrated Plan 12. Contractual Arrangements 13. Universal Access Plan 65% 90% 80% 80% 25% 60% 40% 75% 60% 60% 55% 10% 75% R40 Northern Section R37 to Nels River Designs completed and contractor on site Length - 2,3km Estimated Project Value – R59,0m (Incl. VAT) Expenditure to June 2013 – R21,2m Committed Expenditure 2013/14 – R37m Project period: 8 month contract from March 2013 Nels River Future University Precinct Programme R37 R40 Central Section: R37 to Geelhout Street Designs have been completed Length - 4.3km Contractor appointment underway Estimated Project Value – R34m Expenditure to June 2013 – R0,0m Planned Expenditure 2013/14 – R 20m Programme Future University Precinct Phase 1A Phase 1B Future ICC Precinct R40 Southern Section • Geelhout Street to TUT • Designs completed • Contractor appointment is underway • Length – 2,9km • Estimated Project Value – R 53,5m • Expenditure to June 2013 – R 1.3m • Estimated Expenditure 2013/14 – R52m Geelhout Str Programme TUT Nelspruit PT Rank • Land Acquisition – R8.0 m • Designs completed • Contractor appointment underway • Estimated Project Value – R54.0 m • Expenditure to June 2013 – R7.9m • Committed Expenditure 2013/14 – R40m • Project period - 10 months Programme CBD Intersections / PT Priority Lanes • Consultants in the process of being appointed to prepare detailed designs • Estimated Project Value – R 55.0m • Expenditure to June 2013 – R 0m • Committed Expenditure – R 4.0m • Designs to be finalized Jan Programme 2014 • Implementation to commence June 2015 R 40 Stations: Rocky Drift • Designs completed • Contract for implementation in the process of being awarded • Estimated Project Value – R10m • Expenditure to June 2013 – R139 121.72 • Committed Expenditure 2013/14 – R9.9m • Implementation to commence in Oct 2013 Programme • Contract period 4 months Measure Detail Progress 1234 1 Universal Design Access Plan (UDAP) Development of an NDoT approved plan for the municipality, for the current project phase 2 Appointment of an access consultant Appointment of a suitably qualified access consultant 3 Conforming to national legislation • • • NLTA 2009 Building Regulations 2008 Promotion of Equality and Prevention of Unfair Discrimination Act 2000 1234 4 Conforming with PTIS grant conditions Production or update of the approved UDAP and meeting minimum standards of Part S of the Building Regulations in all infrastructure elements 1234 5 Conforming with the PTIS grant guidelines The requirements provided in the PTIS grant guidelines have been met 1234 1234 Complete the progress box in the following way: 0) Not achieved, 1) partially achieved, 2) halfway, 3) nearly achieved, 4) completely achieved Eastern residential feeder ranks • Kanyamazane • Consultants to be appointed in this financial year to prepare detailed designs • Project implementation is planned for the next financial year • Estimated Project Value – R43,5m • Planned expenditure for 2013/2014 - R4m Eastern residential feeder ranks • Matsulu • Consultants to be appointed in this financial year to prepare detailed designs • Project implementation is planned for the next financial year • Estimated Project Value – R27,5m • Planned expenditure for 2013/2014 – R2,1m Task Nam e Mbom bela Local Municiplity PTIS PTAP Planning Stream s Infrastucture Projects Priority Routes R 40: from R 37 to Geelhout Street R40: North Widening R 37 to Nels River R 40: Central Section Variable m essage gantries, CCTV, Signage,Pedestrian Safety & Laybyes R 40: South Section: w idening TUT to Geelhout Street R 40 HOV Nels River to Rocky Drift Phase 2 R 40 Hov Rocky Drift to White River Phase 3 CBD Intersection/PT Priority Lanes D 2296 Intersection Priority Routing PT Feeder (Residential) Routes Upgrading Im plem entation- By Section (21km ) Footpaths on PT feeder routes ERC Ranks Residential Feeder-line haul transfer ranks Sw alala Kabokw eni Lehaw u Kanyam azane Matsulu Business Cetres Ranks White River Riverside PT Station Rocky Drift PT Station Bosch Street PT Station TUT PT Station Rob Ferreira Hospital PT Station Hazyview Nelspruit Public Transport Rank Upgrade of exist surface to HD Pavem ent and roof Phase 1 Laybyes ITS (Operating system s) Im plem entation Universal accessability-Retro fit to existing facilities Buscor Lease Buscor 2017 2016 2015 2014 2013 R 181 294 607.91 R 312 856 667.72 R 265 291 851.55 R 114 903 000.58 R 195 842 201.59 R 12 754 790.59 R 168 539 817.32 R 109 080 451.21 R 37 189 903.47 R 0.00 R 914 793.30 R 9 724 951.54 R 9 690 346.17 R 49 794 264.33 R 255 566 900.01 R 113 988 207.28 R 195 842 201.59 R 0.00 R 0.00 R 0.00 R 13 909 371.33 R 0.00 R 0.00 R 0.00 R 0.00 R 19 635 128.66 R 52 255 419.08 R 0.00 R 0.00 R 4 283 891.14 R 0.00 R 13 909 371.33 R 0.00 R 0.00 R 0.00 R 293 891.14 R 203 755.53 R 0.00 R 0.00 R 1 815 799.15 R 9 874 028.59 R 45 329 012.73 R 16 262 460.81 R 0.00 R 0.00 R 28 314 291.55 R 67 778 847.88 R 4 585 204.95 R 37 964 892.46 R 0.00 R 0.00 R 83 638 268.28 R 33 782 123.53 R 0.00 R 288 891.22 R 0.00 R 0.00 R 55 175 474.97 R 5 534 876.73 R 0.00 R 0.00 R 0.00 R 3 343 513.78 R 2 191 362.95 R 49 640 598.24 R 0.00 R 0.00 R 9 955 702.63 R 0.00 R 0.00 R 0.00 R 0.00 R 39 684 895.61 R 39 684 895.61 R 0.00 R 0.00 R 0.00 R 0.00 R 35 387 246.33 R 193 975 426.47 R 10 238 227.68 R 156 369 863.95 R 2 745 704.06 R 32 646 107.04 R 3 611 788.44 R 34 943 560.21 R 2 973 055.44 R 25 205 672.13 R 541 847.87 R 39 030 352.43 R 365 831.87 R 24 544 172.14 R 25 149 018.65 R 37 605 562.52 R 56 149.52 R 11 566 920.49 R 9 549 381.64 R 539 618.38 R 0.00 R 0.00 R 0.00 R 3 823 519.85 R 0.00 R 1 640 821.22 R 0.00 R 1 554 001.16 R 0.00 R 11 198 004.13 R 0.00 R 6 336 904.39 R 0.00 R 6 336 904.39 R 11 417 775.41 R 2 698 330.04 R 57 322 004.41 R 29 174 305.58 R 4 983 568.88 R 10 297 641.35 R 12 934 631.42 R 583 835.90 R 374 628.03 R 28 147 698.83 R 724 159.21 R 0.00 R 0.00 R 0.00 R 0.00 R 0.00 R 0.00 R 0.00 R 0.00 R 71 976 785.29 R 6 146 332.48 R 9 800.79 R 0.00 R 0.00 R 0.00 R 0.00 R 0.00 R 0.00 R 233 982 720.00 R 233 982 720.00 R 15 586 909.09 R 3 802 428.13 R 9 800.79 R 9 800.79 TOTAL PROJECT CASH FLOW (JULY 2013) FINANCIAL YEAR - 2013 Name of Municipality: Mbombela Local Municipality Area Expenditure item Planning costs Project Management R 6 845 641.05 R 5 015 502.36 R 5 790 114.74 Operations Plan (including UDAP) R 2 107 379.64 R 2 107 379.64 R 2 114 953.85 Business Plan R 2 004 150.12 R 2 004 150.12 R 2 011 828.86 R 738 295.02 R 738 295.02 R 741 123.74 R 22 041 138.95 R 16 311 799.61 R 19 112 425.41 Communications and Marketing Plan Preliminary and Detailed Infrastructure Design Monitoring & Evaluation Equipment costs R 839 684.59 R 932 585.86 R 935 685.54 Trunk vehicles R 0.00 R 0.00 R 0.00 Complementary Vehicles R 0.00 R 0.00 R 0.00 Feeder Vehicles R 0.00 R 0.00 R 0.00 Fare systems equipment R 0.00 R 0.00 R 0.00 ITS equipment R 0.00 R 233 982 720.00 R 0.00 Other (Universal access) Roadway civil works Top structures for stations / stops Infrastructure costs Infrastructure maintenance costs Transitional costs TOTAL 2015 2014 2013 R 0.00 R 15 586 909.09 R 0.00 R 101 118 815.17 R 13 704 818.58 R 58 416 588.55 R 45 599 503.37 R 11 351 279.31 R 145 884 158.60 R 0.00 Depots R 0.00 R 0.00 Control Centre R 0.00 R 0.00 R 0.00 Land and property acquisition R 0.00 R 7 318 800.00 R 41 974 800.00 Other (Lease agreement) R 0.00 R 3 802 428.13 R 0.00 Infrastructure maintanance R 0.00 R 0.00 R 0.00 Other (specify) R 0.00 R 0.00 R 0.00 Industry compensation R 0.00 R 0.00 R 0.00 Other (specify) R 0.00 R 0.00 R 0.00 R 181 294 607.91 R 312 856 667.72 R 265 291 851.55 Task Nam e Mbom bela Local Municiplity PTIS PTAP Planning Stream s Infrastucture Projects Priority Routes R 40: from R 37 to Geelhout Street R40: North Widening R 37 to Nels River R 40: Central Section Variable m essage gantries, CCTV, Signage,Pedestrian Safety & Laybyes R 40: South Section: w idening TUT to Geelhout Street R 40 HOV Nels River to Rocky Drift Phase 2 R 40 Hov Rocky Drift to White River Phase 3 CBD Intersection/PT Priority Lanes D 2296 Intersection Priority Routing PT Feeder (Residential) Routes Upgrading Im plem entation- By Section (21km ) Footpaths on PT feeder routes ERC Ranks Residential Feeder-line haul transfer ranks Sw alala Kabokw eni Lehaw u Kanyam azane Matsulu Business Cetres Ranks White River Riverside PT Station Rocky Drift PT Station Bosch Street PT Station TUT PT Station Rob Ferreira Hospital PT Station Hazyview Nelspruit Public Transport Rank Upgrade of exist surface to HD Pavem ent and roof Phase 1 Laybyes ITS (Operating system s) Im plem entation Universal accessability-Retro fit to existing facilities Buscor Lease Buscor Q1 2013 Q2 2013 Q3 2013 Q4 2013 2013 R 40 582 613.36 R 51 132 697.83 R 42 668 805.71 R 46 910 491.01 R 181 294 607.91 R 3 156 103.65 R 3 249 004.92 R 3 150 550.23 R 3 199 131.79 R 12 754 790.59 R 37 426 509.71 R 47 883 692.91 R 39 518 255.48 R 43 711 359.22 R 168 539 817.32 R 29 566 833.58 R 32 967 929.30 R 18 905 509.47 R 27 640 178.86 R 109 080 451.21 R 20 468 720.22 R 16 721 183.25 R 0.00 R 0.00 R 37 189 903.47 R 1 187 903.29 R 1 159 170.15 R 4 275 132.85 R 13 012 922.37 R 7 910 210.07 R 15 087 575.90 R 14 630 376.62 R 14 627 256.49 R 0.00 R 0.00 R 0.00 R 0.00 R 0.00 R 0.00 R 0.00 R 0.00 R 1 773 011.06 R 1 773 011.06 R 664 677.74 R 73 191.28 R 0.00 R 0.00 R 0.00 R 0.00 R 19 635 128.66 R 52 255 419.08 R 0.00 R 0.00 R 4 283 891.14 R 0.00 R 0.00 R 0.00 R 0.00 R 0.00 R 0.00 R 0.00 R 6 086 665.07 R 13 142 752.55 R 19 948 068.27 R 0.00 R 1 576 225.94 R 2 401 868.09 R 0.00 R 0.00 R 0.00 R 0.00 R 0.00 R 0.00 R 0.00 R 0.00 R 0.00 R 0.00 R 952 353.96 R 1 451 206.03 R 0.00 R 623 871.98 R 950 662.06 R 6 086 665.07 R 11 566 526.61 R 17 546 200.18 R 0.00 R 0.00 R 0.00 R 0.00 R 0.00 R 0.00 R 3 125 443.03 R 3 474 115.71 R 3 339 848.47 R 0.00 R 0.00 R 0.00 R 0.00 R 0.00 R 0.00 R 0.00 R 0.00 R 0.00 R 0.00 R 0.00 R 0.00 R 2 961 222.04 R 8 092 410.90 R 14 206 351.71 R 2 961 222.04 R 8 092 410.90 R 14 206 351.71 R 0.00 R 0.00 R 55 175 474.97 R 5 534 876.73 R 0.00 R 0.00 R 0.00 R 3 343 513.78 R 2 191 362.95 R 49 640 598.24 R 0.00 R 0.00 R 9 955 702.63 R 0.00 R 0.00 R 0.00 R 0.00 R 39 684 895.61 R 39 684 895.61 R 0.00 R 0.00 R 15 997 989.08 R 1 556 782.70 R 0.00 R 0.00 R 0.00 R 939 953.79 R 616 828.91 R 14 441 206.38 R 0.00 R 0.00 R 16 295.42 R 0.00 R 0.00 R 0.00 R 0.00 R 14 424 910.96 R 14 424 910.96 TOTAL PROJECT CASH FLOW (JULY 2013) FINANCIAL YEAR - 2013 Name of Municipality: Mbombela Local Municipality Area Expenditure item Project Management Planning costs PTI Grant R 1 749 478.00 R 1 906 133.62 R 1 594 985.08 Total R 1 595 044.35 R 6 845 641.05 R 524 826.35 R 2 107 379.64 Business Plan R 506 796.58 R 506 796.58 R 491 439.11 R 499 117.85 R 2 004 150.12 Communications and Marketing Plan R 186 695.29 R 186 695.29 R 181 037.86 R 183 866.58 R 738 295.02 R 10 058 740.41 R 5 431 858.61 R 3 986 690.16 R 2 563 849.77 R 22 041 138.95 R 142 925.04 R 235 826.31 R 228 680.06 R 232 253.18 R 839 684.59 Trunk vehicles R 0.00 R 0.00 R 0.00 R 0.00 R 0.00 Complementary Vehicles R 0.00 R 0.00 R 0.00 R 0.00 R 0.00 Feeder Vehicles R 0.00 R 0.00 R 0.00 R 0.00 R 0.00 Fare systems equipment R 0.00 R 0.00 R 0.00 R 0.00 R 0.00 ITS equipment R 0.00 R 0.00 R 0.00 R 0.00 R 0.00 Other (specify) R 0.00 R 0.00 R 0.00 R 0.00 R 0.00 R 24 689 528.12 R 30 992 620.36 R 18 351 648.65 R 2 715 549.32 R 11 339 866.46 R 17 317 572.70 R 27 085 018.04 R 101 118 815.17 R 14 226 514.89 R 45 599 503.37 Depots R 0.00 R 0.00 R 0.00 R 0.00 R 0.00 Control Centre R 0.00 R 0.00 R 0.00 R 0.00 R 0.00 Land and property acquisition R 0.00 R 0.00 R 0.00 R 0.00 R 0.00 Other (specify) R 0.00 R 0.00 R 0.00 R 0.00 R 0.00 Infrastructure maintanance R 0.00 R 0.00 R 0.00 R 0.00 R 0.00 Other (specify) R 0.00 R 0.00 R 0.00 R 0.00 R 0.00 Industry compensation R 0.00 R 0.00 R 0.00 R 0.00 R 0.00 R 0.00 R 0.00 R 0.00 R 0.00 R 0.00 Other (specify) TOTAL 4th Quarter PTI Grant R 516 752.09 Top structures for stations / stops Transitional costs 3rd Quarter PTI Grant R 532 900.60 Roadway civil works Infrastructure maintenance costs 2nd Quarter PTI Grant R 532 900.60 Monitoring & Evaluation Infrastructure costs 1st Quarter Operations Plan (including UDAP) Preliminary and Detailed Infrastructure Design Equipment costs 2013 (July-Sep) 2013 (Oct-Dec) 2014 (Jan-Mar) 2014 (Apr-June) R 40 582 613.36 R 51 132 697.83 R 42 668 805.71 R 46 910 491.01 R 181 294 607.91 Task Nam e Mbom bela Local Municiplity PTIS PTAP Planning Stream s Infrastucture Projects Priority Routes R 40: from R 37 to Geelhout Street R40: North Widening R 37 to Nels River R 40: Central Section Variable m essage gantries, CCTV, Signage,Pedestrian Safety & Laybyes R 40: South Section: w idening TUT to Geelhout Street R 40 HOV Nels River to Rocky Drift Phase 2 D 2296 Intersection Priority Routing PT Feeder (Residential) Routes Upgrading Im plem entation- By Section (21km ) Footpaths on PT feeder routes ERC Ranks Residential Feeder-line haul transfer ranks Sw alala Kabokw eni Lehaw u Kanyam azane Matsulu Business Cetres Ranks White River Riverside PT Station Rocky Drift PT Station Bosch Street PT Station TUT PT Station Rob Ferreira Hospital PT Station Hazyview Nelspruit Public Transport Rank Upgrade of exist surface to HD Pavem ent and roof Phase 1 Laybyes ITS (Operating system s) Im plem entation Universal accessability-Retro fit to existing facilities Buscor Lease Buscor Q1 2014 R 23 169 825.32 R 2 450 432.36 R 19 757 859.41 R 13 213 121.18 R 0.00 2014 Q4 2014 Q3 2014 Q2 2014 R 9 819 311.66 R 96 149 545.77 R 183 717 984.97 R 312 856 667.72 R 9 690 346.17 R 2 413 304.61 R 2 450 432.36 R 2 376 176.84 R 1 710 664.95 R 6 576 970.66 R 21 748 769.31 R 49 794 264.33 R 0.00 R 13 909 371.33 R 0.00 R 696 250.15 R 0.00 R 0.00 R 0.00 R 0.00 R 13 213 121.18 R 0.00 R 0.00 R 0.00 R 696 250.15 R 0.00 R 0.00 R 0.00 R 0.00 R 0.00 R 0.00 R 0.00 R 0.00 R 0.00 R 0.00 R 203 755.53 R 13 909 371.33 R 0.00 R 0.00 R 203 755.53 R 0.00 R 0.00 R 6 470 420.93 R 229 528.21 R 0.00 R 0.00 R 0.00 R 137 019.00 R 92 509.21 R 6 240 892.72 R 0.00 R 0.00 R 940 097.50 R 774 377.72 R 160 333.08 R 210 907.35 R 173 609.08 R 137 019.00 R 92 509.21 R 165 719.78 R 0.00 R 0.00 R 6 504 905.40 R 4 581 368.92 R 1 282 664.67 R 1 687 258.83 R 1 388 872.61 R 132 866.91 R 89 705.90 R 1 923 536.48 R 0.00 R 0.00 R 0.00 R 0.00 R 0.00 R 0.00 R 6 240 892.72 R 6 240 892.72 R 0.00 R 0.00 R 34 334.86 R 17 696.93 R 17 676.32 R 0.00 R 96 011.67 R 96 011.67 R 0.00 R 0.00 R 503 797.72 R 516 453.62 R 515 783.83 R 387 501.31 R 0.00 R 0.00 R 0.00 R 0.00 R 21 471 822.50 R 4 652 952.83 R 1 302 706.31 R 1 713 622.26 R 1 410 573.75 R 134 942.96 R 91 107.55 R 16 818 869.67 R 56 149.52 R 539 618.38 R 0.00 R 3 285 387.27 R 1 106 670.67 R 1 020 541.01 R 10 810 502.82 R 0.00 R 0.00 R 0.00 R 0.00 R 35 387 246.33 R 10 238 227.68 R 2 745 704.06 R 3 611 788.44 R 2 973 055.44 R 541 847.87 R 365 831.87 R 25 149 018.65 R 56 149.52 R 539 618.38 R 0.00 R 3 823 519.85 R 1 640 821.22 R 1 554 001.16 R 11 198 004.13 R 6 336 904.39 R 6 336 904.39 R 961 533.55 R 80 860 342.50 R 153 122 377.50 R 233 982 720.00 R 80 860 342.50 R 153 122 377.50 R 233 982 720.00 R 5 472 000.00 R 15 586 909.09 R 4 725 818.18 R 5 389 090.91 R 3 802 428.13 R 961 533.55 R 946 964.86 R 932 396.17 TOTAL PROJECT CASH FLOW (JULY 2013) FINANCIAL YEAR - 2014 Name of Municipality: Mbombela Local Municipality Area Expenditure item Project Management Planning costs Equipment costs 1st Quarter 2nd Quarter 3rd Quarter 4th Quarter PTI Grant PTI Grant PTI Grant PTI Grant Total R 1 074 781.65 R 1 272 586.53 R 1 522 938.63 R 5 015 502.36 R 532 900.60 R 516 752.09 R 524 826.35 R 2 107 379.64 Business Plan R 506 796.58 R 506 796.58 R 491 439.11 R 499 117.85 R 2 004 150.12 Communications and Marketing Plan Preliminary and Detailed Infrastructure Design Monitoring & Evaluation R 186 695.29 R 186 695.29 R 181 037.86 R 183 866.58 R 738 295.02 R 454 171.79 R 1 023 487.30 R 6 262 651.85 R 8 571 488.67 R 16 311 799.61 R 235 826.31 R 235 826.31 R 228 680.06 R 232 253.18 R 932 585.86 Trunk vehicles R 0.00 R 0.00 R 0.00 R 0.00 R 0.00 Complementary Vehicles R 0.00 R 0.00 R 0.00 R 0.00 R 0.00 Feeder Vehicles R 0.00 R 0.00 R 0.00 R 0.00 R 0.00 Fare systems equipment R 0.00 R 0.00 R 0.00 R 0.00 R 0.00 ITS equipment R 0.00 R 0.00 Other (Universal access) R 0.00 R 4 725 818.18 R 5 389 090.91 R 13 104 209.00 R 600 609.58 R 6 042 496.65 R 0.00 Depots R 0.00 Control Centre R 0.00 R 80 860 342.50 R 153 122 377.50 R 233 982 720.00 R 5 472 000.00 R 15 586 909.09 R 0.00 R 0.00 R 13 704 818.58 R 0.00 R 5 308 782.66 R 11 351 279.31 R 0.00 R 0.00 R 0.00 R 0.00 R 0.00 R 0.00 R 0.00 R 0.00 R 0.00 R 0.00 R 0.00 R 7 318 800.00 R 7 318 800.00 R 961 533.55 R 932 396.17 R 946 964.86 R 961 533.55 R 3 802 428.13 Infrastructure maintanance R 0.00 R 0.00 R 0.00 R 0.00 R 0.00 Other (specify) R 0.00 R 0.00 R 0.00 R 0.00 R 0.00 Industry compensation R 0.00 R 0.00 R 0.00 R 0.00 R 0.00 Other (specify) R 0.00 R 0.00 R 0.00 R 0.00 R 0.00 R 23 169 825.32 R 9 819 311.66 Other (Lease agreement) TOTAL 2014 R 532 900.60 Land and property acquisition Transitional costs 2014 R 1 145 195.55 Top structures for stations / stops Infrastructure maintenance costs 2014 Operations Plan (including UDAP) Roadway civil works Infrastructure costs 2014 R 96 149 545.77 R 183 717 984.97 R 312 856 667.72 Task Nam e Mbom bela Local Municiplity PTIS PTAP Planning Stream s Infrastucture Projects Priority Routes R 40: from R 37 to Geelhout Street R40: North Widening R 37 to Nels River R 40: Central Section Variable m essage gantries, CCTV, Signage,Pedestrian Safety & Laybyes Total Cost Incl VAT R 1 578 267 353.19 R 36 350 040.00 R 1 114 134 593.19 R 146 101 997.19 R 59 000 000.00 R 33 544 500.00 R 40: South Section: w idening TUT to Geelhout Street R 40 HOV Nels River to Rocky Drift Phase 2 R 40 Hov Rocky Drift to White River Phase 3 CBD Intersection/PT Priority Lanes D 2296 Intersection Priority Routing R 53 557 497.19 R 183 921 900.00 R 111 435 000.00 R 54 492 000.00 R 54 720 000.00 PT Feeder (Residential) Routes Upgrading Im plem entation- By Section (21km ) R 145 008 000.00 Footpaths on PT feeder routes ERC Ranks Residential Feeder-line haul transfer ranks Sw alala Kabokw eni Lehaw u Kanyam azane Matsulu Business Cetres Ranks White River Riverside PT Station Rocky Drift PT Station Bosch Street PT Station TUT PT Station Rob Ferreira Hospital PT Station Hazyview Nelspruit Public Transport Rank Land Purchase Upgrade of exist surface to HD Pavem ent and roof Phase 1 Laybyes ITS (Operating system s) Im plem entation Universal accessability-Retro fit to existing facilities Buscor Lease Buscor R 20 007 000.00 R 398 448 696.00 R 201 317 274.00 R 40 375 380.00 R 48 852 990.00 R 41 113 359.00 R 43 499 550.00 R 27 475 995.00 R 197 131 422.00 R 56 269 830.00 R 10 089 000.00 R 10 084 098.00 R 10 084 098.00 R 10 084 098.00 R 10 084 098.00 R 36 434 400.00 R 54 001 800.00 R 7 980 000.00 R 46 021 800.00 R 0.00 R 233 982 720.00 R 233 982 720.00 R 22 800 000.00 R 22 800 000.00 R 148 200 000.00 2013/2014 Milestone Q1 Nelspruit PT Rank – contract awarded Q2 Kanyamazane & Matsulu residential ranks Design & procurement commences Q3 Rocky Drift PT Station - construction completed Q3 CBD Intersection /PT Priority Lanes – designs completed Q4 Nelspruit PT Rank – construction completed Mbombela Local Municipality Year: 2013/14 Status of Plans Month START OF YEAR July August September October November December January February March April May June END OF YEAR Operational Business Finance Industry Transition Operating Contracts Preliminary Designs Detailed Designs 80% 80% 80% 85% 85% 90% 100% 95% 100% % complete at start of municipal financial year 90% 75% 25% 10% 90% 75% 25% 10% 90% 75% 25% 10% 95% 80% 35% 20% 95% 80% 35% 20% 95% 80% 35% 70% 100% 100% 100% 80% 100% 90% 100% 100% 60% 60% 60% 70% 70% 70% 75% 90% 100% 60% 60% 60% 70% 70% 70% 75% 90% 100% 100% Planned % complete at end of municipal financial year 100% 100% 100% 100% 100% 100% Governance and stakeholder engagement: Business and operational planning: ◦ Concluding MoU between MLM and MPG ◦ Establishing Committee structures ◦ Establishing Inter-Governmental Forum (IGF) ◦ Finalise business, operational and financial plans Complete demand modelling update, with updated transport record Institutional framework, structure and plan, with transport entity Migration plan (if MPG participate) Revise financial plan, with updated subsidy and cost information ◦ Finalise ITS requirements and activate tender process ◦ Implement communications strategy and plan ◦ Continue with universal access planning and implementation Formation of transport entity: ITS establishment: Fleet mobilisation: Infrastructure: ◦ Establish and resource transport unity within MLM ◦ Finalise requirements and specifications ◦ Draw up tender documents ◦ Undertake tender process ◦ Commence formal engagement with industry ◦ Initiate business transformation process ◦ Due diligence and negotiate contracts ◦ Continue with priority infrastructure projects: R 40 upgrades Nelspruit Public Transport Rank CBD Intersection /priority lanes Rocky Drift, White River and Hazyview Public Transport Ranks Ranks in the Eastern residential areas Status of Plans Quarter Operational Business Finance Industry Transition Operating Contracts Preliminary Design Detailed Design % complete at start of municipal financial year START OF YEAR 75% 90% 60% 25% 40% 100% 60% 1st Quarter 100% 100% 70% 30% 40% 60% 2nd Quarter 80% 40% 50% 60% 3rd Quarter 90% 50% 60% 70% 4th Quarter 100% 60% 75% 75% Planned % complete at end of municipal financial year END OF YEAR 100% 100% 100% 60% 75% 100% 75% Security of funding Inter-governmental cohesion Taxi industry participation and compensation Self-sustainability and subsidy regime Costing and cost escalation Programme Risk identified Mitigation measure 0 UDAP None N/A 1 Transport planning Impasse in engaging MPG to access information & solicit participation Bilateral meetings Drafted MoU Escalated to NDoT 2 Operational context N/A 3 Marketing and communications Impasse with MPG delaying engaging stakeholders 4 Customer care N/A 5 Fare system N/A 6 Passenger information N/A 7 Infrastructure Progressing without participation of MPG Bilateral meetings Drafted MoU 8 Vehicles N/A N/A Bilateral meetings Drafted MoU The public transport challenge in Mbombela has been evidenced along with the need for reform The public transport solution in MLM will differ significantly from those in the larger Metros ◦ Principally due to 81% of the employment opportunities being concentrated in the NelspruitWhite River development corridor, while the majority (87%) of the population are dispersed in dense rural settlements of the Eastern/Southern Nsikazi corridor. ◦ Unlike the major metros, the focus is on providing an integrated, affordable, efficient and effective public transport solution to address the commuter challenge from outlying communities, rather than focusing on reducing road congestion through influencing modal balances, by means of migrating commuters from private cars to public transport.
