Bustadkreditt Sogn og Fjordane AS cover pool data
advertisement
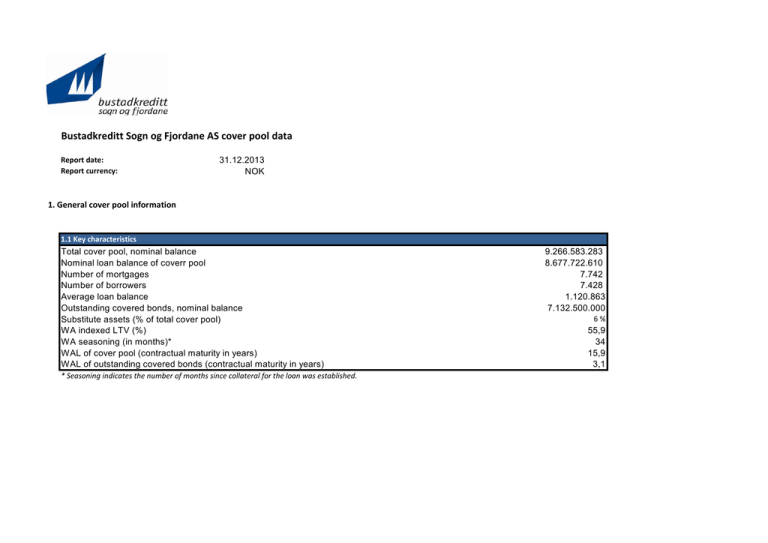
Bustadkreditt Sogn og Fjordane AS cover pool data Report date: Report currency: 31.12.2013 NOK 1. General cover pool information 1.1 Key characteristics Total cover pool, nominal balance Nominal loan balance of coverr pool Number of mortgages Number of borrowers Average loan balance Outstanding covered bonds, nominal balance Substitute assets (% of total cover pool) WA indexed LTV (%) WA seasoning (in months)* WAL of cover pool (contractual maturity in years) WAL of outstanding covered bonds (contractual maturity in years) * Seasoning indicates the number of months since collateral for the loan was established. 9.266.583.283 8.677.722.610 7.742 7.428 1.120.863 7.132.500.000 6% 55,9 34 15,9 3,1 1.2 Overcollateralisation* Cover pool size Nominal Residential mortgages, eligible loan balance Residential mortgages, non eligible loan balance Total cover pool (incl. non eligible loan balance) Total cover pool, eligible loan balance 8.630.961.586 46.761.024 588.860.673 9.266.583.283 9.219.822.259 Covered bonds outstanding 7.132.500.000 Substitue assets Overcollateralisation (incl. non eligible loan balance) Overcollateralisation, eligible loan balance 29,9 % 29,3 % * The nominal Overcollateralisation (OC) percentage may change from time to time and may be reduced in the future. However, Bustadkreditt Sogn og Fjordane 1.4 Maturity structure covered bonds Extended maturity (years) 0-1 1-2 2-3 3-5 5-10 Over 10 Total Maturity (years) 0-1 1-2 2-3 3-5 5-10 Over 10 Total Loan balance 432.500.000 0 1.200.000.000 2.700.000.000 2.800.000.000 0 7.132.500.000 % 6,1 0,0 16,8 37,9 39,3 0,0 100,0 % % % % % % % 0,0 22,9 23,8 39,3 14,0 0,0 100,0 % % % % % % % Loan balance 0 1.632.500.000 1.700.000.000 2.800.000.000 1.000.000.000 0 7.132.500.000 % 2. Composition of the residential mortgage cover pool 2.1 Property types Loan balance House Flat in block with less than 4 units Flat in block with 4 or more units PARTIAL COMMERCIAL USE Total 6.326.389.441 1.702.467.481 582.440.843 66.424.845 8.677.722.610 % 72,9 19,6 6,7 0,8 100,0 % % % % % 2.2 Largest borrowers Private individuals 5 largest (% of total mortgages) 10 largest (% of total mortgages) 0,7 % 1,2 % 2.3 Occupancy type Loan balance Owner occupied Buy-to-let Second home No data Total 8.232.569.006 92.785.687 259.016.542 93.351.376 8.677.722.610 % 94,9 1,1 3,0 1,1 100,0 % % % % % 70,4 0,3 0,0 0,0 29,2 100,0 % % % % % % 2.4 Repayment type Loan balance Monthly Quarterly/Semi-annually Annualy BULLET Other* Total * Refers to flexible loans 6.108.888.990 30.367.836 2.089.769 0 2.536.376.015 8.677.722.610 % 2.5 Flexible loans Drawn balance Total limit on flexible loans Percentage drawn of limit WA LTV* 3.793.996.331 4.970.839.730 76,3 % 38,0 % * The WA LTV is calculated based on drawn balance. 2.6 LTV buckets Indexed LTV ≥ 0 ≤ 40 40 ≤ 50 50 ≤ 60 60 ≤ 70 70 ≤ 80 80 ≤ 85 85 ≤ 90 90 ≤ 95 95 ≤ 100 100 ≤ 105 > 105 Total 1.618.913.627 948.701.241 1.241.187.240 1.676.954.759 1.479.634.471 465.092.515 316.431.061 202.059.564 156.554.709 146.967.318 425.226.106 8.677.722.610 18,7 10,9 14,3 19,3 17,1 5,4 3,6 2,3 1,8 1,7 4,9 100,0 % % % % % % % % % % % % 19,7 25,2 18,4 16,2 20,5 100,0 % % % % % % 2.7 Seasoning* Loan balance 0-12 12-24 24-36 36-60 Over 60 Total * Seasoning indicates the number of months since the loan was established. 1.710.065.999 2.186.244.916 1.598.494.921 1.407.543.217 1.775.373.558 8.677.722.610 % 2.8 Interest rate type Loan balance Floating rate Fixed rate with reset < 2 years Fixed rate with reset ≥ 2 but < 5 years Fixed rate with reset ≥ 5 years Total 8.677.722.610 0 0 0 8.677.722.610 % 100,0 0,0 0,0 0,0 100,0 % % % % % 2.9 Loan performance Loan balance Performing loans Delinquent loans (arrears 31 to 90 days) Gross non performing loans (arrears 91 days +) Total 8.677.616.730 0 105.880 8.677.722.610 % 100,00 0,00 0,00 100,0 % % % % 2.10 Geographical distribution Akershus Aust-Agder Buskerud Finnmark Hedmark Hordaland Møre og Romsdal Nordland Nord-Trøndelag Oppland Oslo Østfold Rogaland Sogn og Fjordane Sør-Trøndelag Telemark Troms Vest-Agder Vestfold Total Loan balance 559.805.525 28.988.868 88.465.934 5.929.022 25.958.711 2.140.567.566 153.264.695 17.766.857 4.489.520 42.171.398 809.322.771 59.906.190 213.808.348 4.341.255.457 68.512.927 9.165.776 12.979.557 32.754.295 62.609.192 8.677.722.610 6,5 0,3 1,0 0,1 0,3 24,7 1,8 0,2 0,1 0,5 9,3 0,7 2,5 50,0 0,8 0,1 0,1 0,4 0,7 100,0 % Average loan balance % % % % % % % % % % % % % % % % % % % % 1.617.935 1.260.386 1.361.014 988.170 961.434 1.371.280 1.206.809 1.045.109 897.904 1.240.335 1.590.025 1.152.042 1.549.336 908.402 1.007.543 763.815 1.179.960 1.488.832 1.490.695 1.120.863 3. List of oustanding covered bonds ISIN NO0010504194 NO0010572290 NO0010593155 NO0010630973 NO0010625619 NO0010637101 NO0010660020 NO0010665177 NO0010673395 ISIN NO0010504194 NO0010572290 NO0010593155 NO0010630973 NO0010625619 NO0010637101 NO0010660020 NO0010665177 NO0010673395 Legal final (or "extended" maturity date, dd/mm/yyyy ) Current balance Date of issuance 432.500.000 700.000.000 700.000.000 500.000.000 1.000.000.000 1.000.000.000 800.000.000 1.000.000.000 1.000.000.000 ######## ######## ######## ######## ######## ######## ######## ######## ######## 17.08.2014 27.04.2015 10.03.2016 07.12.2015 28.06.2016 17.02.2017 18.04.2018 13.08.2019 20.09.2018 Interest payment Principal payment frequency frequency INTEREST RATE TYPE Interest margin where floating rate Currency NOK NOK NOK NOK NOK NOK NOK NOK NOK (Norway) (Norway) (Norway) (Norway) (Norway) (Norway) (Norway) (Norway) (Norway) Quarterly Quarterly Quarterly Quarterly Quarterly Quarterly Quarterly Quarterly Quarterly BULLET BULLET BULLET BULLET BULLET BULLET BULLET BULLET BULLET Floating Floating Floating Floating Floating Floating Floating Floating Floating Maturity date rate rate rate rate rate rate rate rate rate 40 55 58 70 55 72 55 58 48 17.08.2015 27.04.2016 10.03.2017 07.12.2016 28.06.2017 17.02.2018 18.04.2019 13.08.2020 20.09.2019 BASIS over which interest margin is calculated Nibor Nibor Nibor Nibor Nibor Nibor Nibor Nibor Nibor 3 3 3 3 3 3 3 3 3 month month month month month month month month month Next Interest Payment Date (dd/mm/yyyy) 17.02.2014 27.01.2014 10.03.2014 07.03.2014 28.03.2014 17.02.2014 20.01.2014 13.02.2014 20.03.2014 Structured features Call 12 mnth before final maturity 12 mnth extension periode 12 mnth extension periode 13 mnth extension periode 12 mnth extension periode 12 mnth extension periode 12 mnth extension periode 12 mnth extension periode 12 mnth extension periode Next Principal Payment Date (dd/mm/yyyy) 17.08.2014 27.04.2015 10.03.2016 07.12.2015 28.06.2016 17.02.2017 18.04.2018 13.08.2019 20.09.2018 Private Issuance? Yes No No No No No No No No FLEKSILÅN FLEKSILÅN TILSETTE 30-90 Over 90 1-2 1-2 2-3 1-2 2-3 3-5 3-5 5-10 3-5 0-1 2-3 3-5 2-3 3-5 3-5 5-10 5-10 5-10
