PowerPoint - Susan Schwinning
advertisement
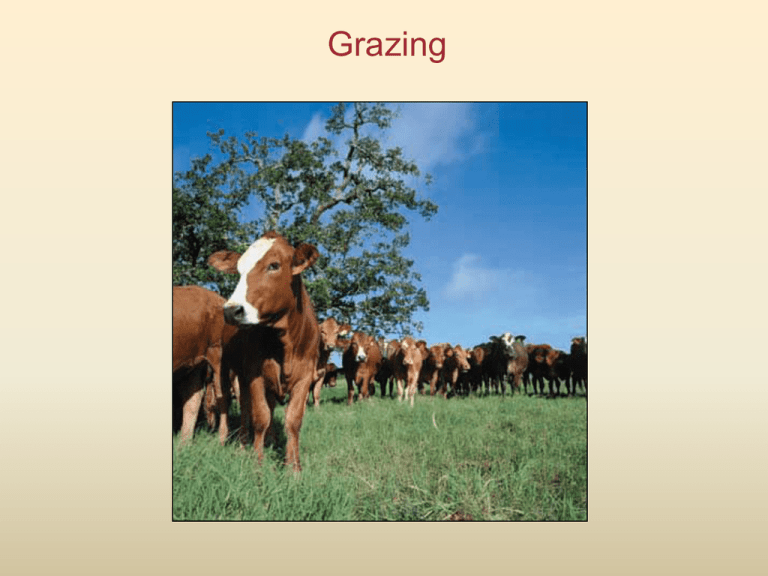
Grazing Grazing: A form of exploitation where the prey (primary producer) is not killed. Typically involves low vegetation (grasses, herbs, algal mats), not taller, woody plants (“browsing”). Global distribution of grazed land: Grazed grasslands are the largest single component (25%) of the Earth's 117 million km2 of vegetated lands. In the last 300 years, managed grazing systems have increased 6fold by land cover, and they are rising still. Grazing by biome 1.53 billion (2001) cattle occupy nearly 24 percent of earth’s landmass. Add sheep & goat: 3.3 billion (2001) They weight more than the entire human population. • Forest converted to pasture or production of cattle feed. • Desertification of marginal rangelands in semi-arid and arid regions. • Production of greenhouse gases (CO2, methane, nitrous oxide) 18% of emissions. • Decreased water quality through runoff from fertilized fields and feed lots. • Introduction of invasive species. In the 17 Western States: 1870: 4.1 million beef cattle 4.8 million sheep 1900: 19.6 million beef cattle 25.1 million sheep 1930: great drought Overgrazing – a global issue Since 1945, 3.8% of Earth’s vegetated land have been seriously degraded by overgrazing. The rate of abandonment of dryland due to degradation is 1 million km2 per decade and this rate is probably accelerating. Overgrazing fundamentally changed the face of western states 18 years without cattle 30 years without cattle San Pedro River, AZ in 1984 San Pedro River in 1998 Cattle-free for 12 years Grazing in the Texas Hill Country 1932 2000 Woody Encroachment linked to Grazing: Grazing reduces grass biomass, so that seedlings of woody plants achieve higher growth rates. Fire is suppressed on rangelands, so that seedlings and saplings suffer lower mortality. Grazers compact soils and increase erosion by wind and water, all of which lower grass productivity. Grazers often facilitate seed dispersal. Overgrazing Shrubs replace grasses Increased spatial heterogeneity Soil compaction, loss of soil stability Wind & Water erosion Nutrient loss Irreversible land degradation. Mechanics of grazing: Cow has a specific bite width given by the size of the mouth Cow takes off a fixed percentage of the height of the pasture Cow takes a certain amount of time tearing off a bitefull of grass Cow takes time chewing proportional to bite size Co-evolution of grass and grazer Many large grazers evolved after a global climate change which replaced forests with grasslands at mid-latitudes Grazers evolved several specialized organs to deal with low quality, abrasive food: high-crowned teeth to increase the ability to tear apart abrasive grass leaves Ruminant digestive system Co-evolution of grass and grazer Grasses evolved strategies to escape from grazers: Below-ground storage of carbohydrate to rapidly regrow after grazing Altered morphology under heavy grazing: highly branched and low canopy Red Queen Hypothesis (the evolutionary arms race between consumer and consumed) "It takes all the running you can do, to keep in the same place." The Red Queen said in Lewis Carroll's Through the Looking-Glass. Intake per bite Intake as a function of pasture height: Cattle take about 50% of the standing biomass within the bite area in one bite. Grass height (“prey density”) But there is an ungrazeable horizon. Handling time Handling time as a function of bite size: Taking a bite takes the same amount of time, independent of bite size. Chewing time is proportional to biomass per bite. Bite size Functional response curve for grazing: Daily rate of consumption per animal Reflects limits of grazing time (ca. 13 hours per day) and digestive capacity (ca. 8 kg dry matter) Grazing limited by digestive capacity Grazing limited by time Grass height Non-grazeable horizon this is the effect of the ungrazeable horizon Predator isocline: Predator density Isoclines for free-breeding grazers Victim density Predator isocline: Predator density Free-breeding grazers Victim density Predator isocline: Predator density Free-breeding grazers: the grass “refuge” stabilizes Victim density Taurine cattle (without hump) were domesticated twice: In the near-east, giving rise to all European breeds (humpless cattle) In India (zebu, humped cattle) Zebu cattle probably entered Africa from India. Old-world grasses co-evolved with domesticated cattle for about 70008000 years. New-world grasses did not. This may explain the vulnerability of American prairies to domestic cattle. Alien plant origins: Bromus spec Botriochloa Salsola spec Timothy Wild oat Lehman lovegrass Buffelgrass Bermudagrass Europe (near-east) Europe (near-east) Eurasia Europe Europe South Africa (India and Africa) (Africa) Grass height Increasing stocking rates Total daily rate of grass consumption How about captive animals with fixed stock density? Grass growth or consumption rate grass growth function one cow per acre Grass height Stable grass height for grazing at 1 animal per acre. Grass growth or consumption rate two cows per acre Grass height Grass growth or consumption rate four cows per acre Grass height Grass growth or consumption rate stable equilibrium state unstable equilibrium state five cows per acre Grass height One and the same stocking rate can lead to two stable states: the desired state, where the sward is fast-growing and the cows eat all they can every day, the “overgrazed” state, where the sward is growing slowly and the cows remain hungry. Grass growth or consumption rate 1 five cows per acre 2 Grass height Grass growth or consumption rate Less productive years can easily set the system into the overgrazed state: Theoretically maximal yield: not stable! drier year Grass height Grass growth or consumption rate Recovery from overgrazing is achieved only by drastically reducing stock density: Grass height Grass growth or consumption rate A safe stocking density is well below the maximal sustainable yield for average conditions: Grass height Summary so far: In natural grazing systems, grasses and grazers have co-evolved to sustain one another. Example: the ungrazeable horizon prevents grasses from being eaten to extinction. Grazers are controlled by the state of the grassland and vice versa. For example, grazer numbers decline when there is not enough forage, either by death or migration. Grazers disappear before they irreversibly damage the grassland. In managed grazing systems, grazer numbers (stocking rates) are controlled by the rancher, making it possible for grass and soil system to be damaged beyond repair. Things that are harmful: Supplementary feeding during drought. This maintains an unrealistically large herd. Restocking too soon after drought. This subtracts time for grasses to repair and recover. Summary so far: Theory suggests that harvesting a resource at the maximal rate maximizes the risk of over-exploitation. The pre-cautionary principle therefore suggest to set stocking rate far below the value that would maximize production in an average year. However, economic forces tend to work in the opposite direction. The Tragedy of the Commons Multiple individuals, acting independently and rationally in their own self-interest, will ultimately deplete a shared limited resource, even when it is not in anyone's long-term interest for this to happen. – Hardin 1968. Rancher 1 Rancher 2 Rancher 3 Each rancher, 10 cows Sell 10 calves of 100 kg for $1000 Sell 10 calves of 100 kg for $1000 Sell 10 calves of 100 kg for $1000 Rancher 1 decides to add one cow Sell 11 calves of 99 kg for $ 1089 Sell 10 calves of 99 kg for $ 990 Sell 10 calves of 99 kg for $ 990 Ranchers 2 and 3 follow the lead. Sell 11 calves of 97 kg for $ 1067 Sell 11 calves of 97 kg for $ 1067 Sell 11 calves of 97 kg for $ 1067 Some time later: All ranchers have 20 cows. Sell 20 calves of 40 kg for $ 800 Sell 20 calves of 40 kg for $ 800 Sell 20 calves of 40 kg for $ 800 The tragedy is the result of privatizing profits, while sharing the costs. Summary: Co-evolution of grass and grazer produces stable grazing systems. Lack of co-evolution often causes species extinctions and reorganization of biodiversity. Overstocking causes irreversible loss of species diversity, soil quality and quantity. Unfortunately, there are economic incentives for overstocking. This is what happened when cattle, sheep, goat were introduced to the Americas, Australia and the Pacific Islands. Cattle production is still on the rise globally, at the cost of forest conversion to species-poor grasslands, the spread of exotic, invasive species (which often did co-evolve with cattle), methane production (a greenhouse gas), irreversible land degradation.
