What is a Fish?
advertisement
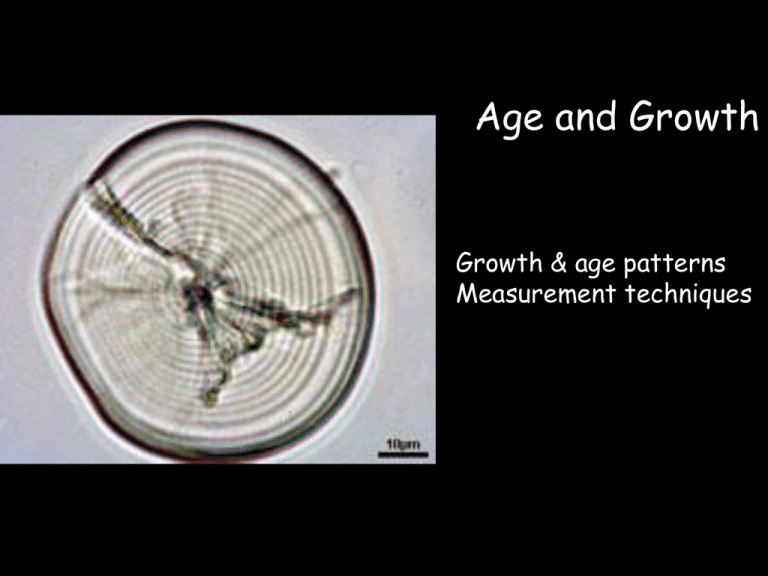
Age and Growth Growth & age patterns Measurement techniques Growth patterns • Determinate Growth – Mammals & birds • Indeterminate Growth – Fishes Indeterminate Size Determinate Age Indeterminate growth & fecundity Fish growth – von Bertalanffy equation Lt=Lmax(1-e-kt) Fish growth – von Bertalanffy equation Length – Weight relation (power function) W=a Lb Growth patterns • Great Plasticity in growth • Size at age: High variability – Between species – Between populations – Between individuals Environmental factors influencing growth • • • • • • • • • Temperature Food and Nutrient Availability Light Regime Oxygen Concentration Salinity Pollutants Predator Densities Intraspecific Social Interactions Genetics Example: Species polymorphism Large benthic feeder Small benthic feeder Piscivorous feeder Salmonidae Artic Charr Salvelinus alpinus Planktivorous feeder Annual growth variation Population Age-Size structure Population Size-Age relationship Age measurement methods • • • • Scales Otoliths Vertebrae Rays/Spines Age measurement through scales Age measurement through otoliths Otolith uses • Age determination – Daily ring counts – Annual ring counts – Radioactive isotopes • Species identification • Paleoclimate studies (018) • Life history studies (elemental tracers) (Oncorhynchus clarkii) Weakfish (Cynoscion regalis) Otolith age validation Otolith age validation Otolith age validation – nuclear fallout Age calculation error case Anoplomatidae Sablefish Anoplopoma fimbria Scales: 3-8 years Otoliths: 4-40 & up to 80 Species identification Dolphin stomach contents Climate studies (isotope 018) Climate studies (isotope 018) (6000 year old fossil) Elemental tracers – Life history (Zn, Sr, Ba, Mn, Fe and Pb) Elemental tracers of weakfish Thorrold et al. 2001 Proof of Natal Homing! Thorrold et al. 2001 How many fish are there? How do populations change? Nt+1 = Nt + B – D + I – E B = births D = deaths I = immigration E = emigration Immigration Stocking Births Deaths Population Angling Emigration Survival • Eggs and larvae suffer the largest losses HATCH Egg Larva Viable & Competent Not Fertile Starvation Inviable Eaten Eaten Other 2 cohorts each produce 10,000,000 eggs 90.5% survivorship/day yields 24,787 survivors at 60 days 95.1% survivorship/day yields 497,871 survivors at 60 days Recruit! Recruitment • Can mean many things! – Number of young-of-year (YOY) fish entering population in a year – Number of fish achieving age/size at which they are vulnerable to fishing gear • Somewhat arbitrary, varies among populations • Major goal of fish population dynamics: understanding the relationship between stock size and recruitment What determines recruitment? -Stock size (number and size of females) Density-independent Ricker What determines recruitment? Beverton-Holt spawning stock biomass (SSB) From: Wootton (1998). Ecology of teleost fishes. Density-independent Ricker What determines recruitment? Beverton-Holt spawning stock biomass (SSB) From: Wootton (1998). Ecology of teleost fishes. Density-independent Ricker What determines recruitment? Beverton-Holt spawning stock biomass (SSB) From: Wootton (1998). Ecology of teleost fishes. The problem? • Stochasticity = variable recruitment! From: Cushing (1996). Towards a science of recruitment in fish populations Highly variable recruitment results in naturally very variable catches From: Jennings, Kaiser and Reynolds (2001). Marine Fisheries Ecology Population Abundance • On rare occasions, abundance can be measured directly – Small enclosed systems – Migration Catch per unit effort (CPUE) • Very coarse and very common index of abundance 1 Catch= 4 fish CPUE=4/48=0.083 Effort= 4 nets for 12 hours each= 48 net hours 2 Catch=8 fish CPUE=8/48=0.167 Effort= 4 nets for 12 hours each= 48 net hours We conclude population 2 is 2X larger than population 1 Estimates of Population Size • Proportional sampling • Rp = size of the range of the population (Rp), (uniform distribution) • Rs = size of sampling a region • Ns/Np = Rs/Rp. • Np = (Ns Rp)/Rs = Population Abundance No Accuracy Estimate Population abundance • Density estimates (#/area) – Eggs estimated with quadrats – Pelagic larvae sampled with modified plankton nets – Juvenile and adult fish with nets, traps, hook and line, or electrofishing • Density is then used as index of abundance, or multiplied by habitat area to get abundance estimate Depletion methods Number Caught Closed population Vulnerability constant for each p Collection efficiency constant Often not simple linear regressio * * * * Number previously caught Estimates of Population Size • Mark & Recapture capture – mark – release - recapture • Np = population abundance • M = number of individuals that are marked • n = size of the second sample of organisms • R: number of marked organisms in second sample Np = (M*n)/R Accuracy Estimates Available Mark recapture M=5 N=population size=???? C=4 R=2 Modified Petersen method • Assumptions: – Closed population – Equal catchability in first sample – Marking does NOT influence catchability • Marked and unmarked fish mix randomly • Mortality rates are equal – Marks are not lost Schnabel method • Closed population • Equal catchabilty in first sample • Marking does NOT influence catchability • Multiple recaptures – Easier to pick up on violation of assumptions
