Οδοί έκθεσης του ανθρώπου σε ιοντίζουσες ακτινοβολίες
advertisement
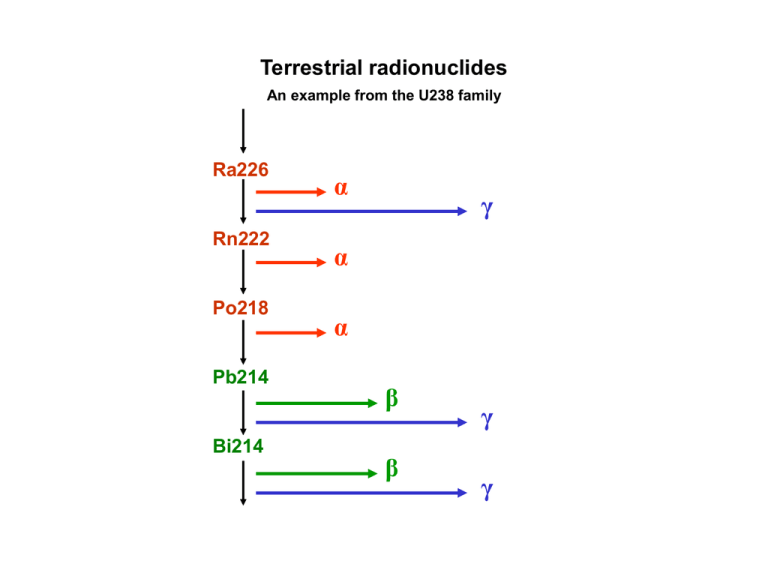
Terrestrial radionuclides An example from the U238 family Ra226 Rn222 Po218 Pb214 Bi214 α γ α α β β γ γ Exposure to ionizing radiation Our body is penetrated each hour approximately by: 500 000 particles of cosmic origin 30 000 α- and β-particles from the radon daughters deposited in the respiratory tract Εξωτερική έκθεση External exposure Εσωτερική έκθεση Internal exposure 200 000 000 γ-quanta from the terrestrial radionuclides 15 000 000 β-particles from the K40 in our tissues Average population doses through various pathways Estimates for USA, in μSv 3600 – total average Sources: 2000 – radon inhalation 390 – isotopes in our body 280 – terrestrial radiation 270 – cosmic radiation 10 – cosmogenic isotopes 600 – technogenic exposure (mainly medical exposure) Terrestrial radionuclides U238 Series U238 Th234 Pa234m U234 Th230 Ra226 Rn222 Po218 Pb214 Bi214 Po214 Pb210 Bi210 Po210 Typical concentrations: 20 – 200 Bq/kg Th232 Series Th232 Ra228 Ac228 Th228 Ra224 Rn220 Po216 Pb212 Bi212 Po212 Typical concentrations : 20 – 200 Bq/kg U235 Series U235 Th231 Pa231 Ac227 Th227 Ra223 Rn219 Po215 Pb211 Bi211 Tl207 Typical concentrations : 1 – 10 Bq/kg K40 Typical concentrations : 100 – 1000 Bq/kg 50V, 87Rb, 113Cd, 115In, 123Te, 138La, 142Ce, 144Nd, 147Sm, 152Gd, 174Hf, 176Lu, 187Re, 190Pt, 192Pt, 209Bi. Typical concentrations : very low, radiologically insignificant. Concentrations of terrestrial radionuclides - Greece U238 Series Reg. averages: 20-60 Bq/kg Th232 Series Reg. averages : 20-60 Bq/kg K40 Reg. averages : 200-800 Bq/kg Terrestrial radiation - Greece Regional dose rate averages, nGy h-1 Natural radionuclides in air U238 Series (Rn222 (radon) and its decay products) Rn222 Po218 Pb214 Bi214 Po214 Typical concentrations: 30 – 200 Bq/m3 indoors 2 – 5 Bq/m3 outdoors Th232 Series (Rn220 (thoron) and its decay products) Rn220 Po216 Pb212 Bi212 Po212 Typical concentrations : typically 10 times lower than those of Rn222 Cosmogenic isotopes C14, H3, Be7 10Be, 26Al, 36Cl, 80Kr, 32Si, 39Ar, 22Na, 35S, 37Ar, 33P, 32P, 38Mg, 24Na, 38S, 31Si, 18F, 39Cl, 38Cl Natural radionuclides in marine water Typical concentrations, Bq/m3 U238 K40 - 33 11000 H3 C14 Rb87 - 0.6 5 1100 Natural radionuclides in food Typical concentrations, Bq/kg Products Banana Brasil nuts Carrots Potatoes Beer Beef Drinking water Κ40 Ra226 130 210 125 125 15 110 0 - 0.5 0.04 40 - 250 0.02 - 0.07 0.04 - 0.1 0.02 0 - 0.01 Natural radioactivity of food Total activity concentration, Bq kg-1 Product Vegetable oil Milk Alcoholic drinks Beer Drinking water Brazil nuts Bananas Tea Pastry Pistachios Total activity conc. 180 Bq kg-1 50 45 15 0.7 500 110 15 5 4.5 Natural radionuclides in human body Typical values, Bq Radionuclide Total activity U238 Th232 K40 Ra226 C14 H3 Po210 1.1 0.11 4400 1.1 15000 23 37 Average daily intake 0.023 0.011 100 0.08 280 1 Technologically enhanced natural radioactivity (TENR) Radiologically important cases Uranium mining and milling Enhanced concentrations of U-series nuclides in areas of waste deposition Lignite power plants Air and soil pollution with lignite ash of enhanced natural radioactivity Building materials Use of lignite ash as cement component, phosphate byproducts, granites Indoor radon The oldest case of TENR, a major contributor to the exposure of the population Radon spas A questionable practice with TENR aspects Also: Phosphate fertilizers, well water sources Nuclear tests in the atmosphere Number and total power per year 70 60 No / MT 50 40 30 20 10 0 40 45 50 55 60 Ετος Year 65 70 75 80 Nuclear tests in the atmosphere Annual and total deposition of Cs137, Bq m-2, Denmark Ετήσια / συνολική εναπόθεση Cs137, Bq/m2 . 4000 3500 . 3000 Total deposition 2500 . 2000 . 1500 . . Annual deposition 1000 500 0 1950 1955 1960 1965 1970 1975 1980 1985 1990 Ετος Year ..................... Nuclear tests .......................... ^ Chernobyl Nuclear tests in the atmosphere Evaluation of Cs137 pollution in Europe Nuclear tests in the atmosphere Radioactive pollution of food, sample values, Bq/kg Year Country Product Nuclide 1957 1959 1961 1962 1963 1964-65 1985 UK USA USA USA USA USA Finland Milk powder Milk Milk Fresh milk Milk Milk Milk 137Cs 1957 1962 1885 USA USA USA Milk Fresh milk Milk 131I 1962 1963 USA USA Fresh milk Milk 90Sr 1960 1985 ΗΠΑ Finland Beef meat Beef meat 137Cs 1980-85 1984 1985 Finland Spain Ireland Lake fish Fish Fish 137Cs 137Cs 42 1–6 8 – 35 1963-67 USA, Utah Animal foodstuff 137Cs 112 137Cs 137Cs 137Cs 137Cs 137Cs 137Cs 131I 131I 90Sr 137Cs 137Cs Concentration 32 3 2 7 5.6 5 0.23 37 20 1.3 1.8 1.0 1.2 0.9 Nuslear tests in the atmosphere Radioactive pollution of food, Cs137, Bq kg-1, USA, 1993 Product Maximum Average Leafy vegetables Other vegetables Fruits Potatoes Pastry Milk products Fish Eggs 210 38 20 11 23 48 7.6 1 21 3 3 1.4 4.3 5 1.9 0.4 Coffee Tea Aromatic species 24 950 580 16 47 29 Nuclear tests in the atmosphere Monthly intake of Cs137, Bq, USA, 1993 600 Intake of Cs137, Bq/month 500 400 300 200 100 0 Dec-62 Mar-63 Jul-63 Total intake in 1993: 3300 Bq. Oct-63 Jan-64 May-64 Related dose: 42 μSv Aug-64 Radioactive pollution of soil Relation between radioactive deposition and rainfall Ραδιενεργός εναπόθεση, kbq/m2 m-2 kBq deposition, Radioactive 1000 Cs137 100 10 Zr95 1 0.1 0 5 10 15 mm Βροχόπτωση, Rainfall, mm 20 25 30 Radioactive pollution of food chain - Α Air - soil pathways of radioactive pollution Inhalation Direct pollution Plants Air Soil Food Animals Source Pollution of – and from water sources ( External radiation ) MAN Radioactive pollution of food chain - Β Fresh and marine water pathways of radioactive pollution Soil pathways to man Soil Direct pollution Washout, irrigation Rivers Fish Plants Lakes, Air Food Sea Fish Pollution source MAN Radioactive pollution of plants Various paths of pollutants propagation External pollution, foliar uptake Evaporation Air clearance Radioactive deposition Washout Resuspension Evaporation Plant metabolism Base uptake Organic layer Root uptake Propagation and fixation in soil Radioactive pollution of animals Various pathways Meat Inhalation Milk Food Chernobyl accident - Greece Radioactive deposition of Cs137 in Europe Chernobyl accident - Greece Radioactive deposition of Cs137 – NTUA and ERL data Chernobyl accident - Greece Marine water pollution (surface) with Cs137 – ERL evaluation Chernobyl accident - Greece Average 1st year and 50-year doses through various pathways, μSv Pathway 1st year 50 years Inhalation External exposure Food - water 22 52 420 22 190 500 TOTAL 490 710 The radiologically most important food chain pathways Grass pollution with Ι131 Grass pollution with Cs137 Pollution of fruits and vegetables > > Sheep and goat milk Sheep and goat milk and meat Animal foodstuff pollutio Cereals pollution > > Meat and milk products, 1986/87 Bread and pastry, 1986/87 Chernobyl accident - Greece Evaluation of weekly doses. Comparison with dose due to natural radioactivity. Dose rate, μSv per week Chernobyl Natural radioactivity Chernobyl accident - Greece Average weekly doses due to Ι131, μSv Εβδομαδιαία δόση I131, μSv 100 10 1 0.1 1 2 3 4 5 6 7 8 Week Εβδομάδα Κατανομή δόσεων από I131 foods Contribution of various 11% 15% 10% 22% Κρέας Meat Milk Γάλα Leafy Φυλ. veg. Λαχαν. Other Αλλα veg. Λαχαν. Fruits Φρούτα 42% Chernobyl accident - Greece Μηνιαίες δόσεις λόγω καισίου Monthly doses from Cs137 and Cs134, μSv 100 10 1 1 3 5 7 9 Μήνας Month 11 Κατανομή δόσεων of από Cs137 και Cs134 Contribution various foods 15% Κρέας Meat 15% 45% Γάλα Milk OtherΑλλα veg. Λαχαν. 0% 23% 2% Fruits Φρούτα Pastry Ζυμαρικά Chernobyl accident - Greece Contribution of different to the doseκαι dueCs134 to Cs137, Cs134 and I131 Κατανομή δόσεων foods από I131, Cs137 στα τρόφιμα 14% Κρέας Meat 35% 17% Γάλα Milk Λαχαν. Φυλ. Leafy veg. Other veg. Λαχαν. Αλλα Fruits Φρούτα 9% 20% 5% Pastry Ζυμαρικά Countermeasures: intervention levels Countermeasure Sheltering Dose levels, mSv Low level High level 5 50 Administration of stable iodine 50 Evaquation Relocation Food banning Food countermeasures Applied in Greece: Organ Average dose, Greece Whole body 0.02 500 Thyroid 0.2 50 500 Whole body 0.05 50 500 Whole body 0.05 5 50 Whole body 0.45 Advices* to avoid consumption of sheep milk and leafy vegetables Control of cheese, cereals and meat and application of the EU limits Temporary banning of small animals consumption Temporary banning of specific types of bread


