Burden of Illness from Air Quality in Toronto – Stephanie Gower
advertisement
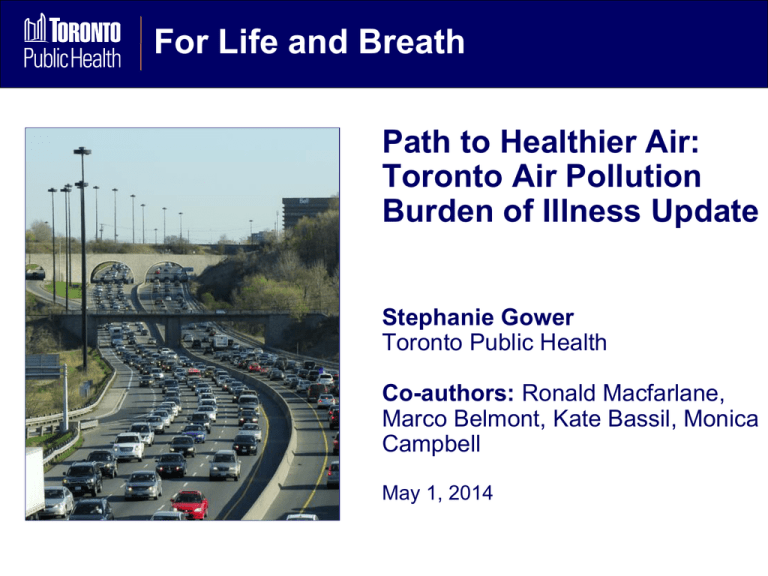
For Life and Breath Path to Healthier Air: Toronto Air Pollution Burden of Illness Update Stephanie Gower Toronto Public Health Co-authors: Ronald Macfarlane, Marco Belmont, Kate Bassil, Monica Campbell May 1, 2014 Toronto and Toronto Public Health • Toronto Public Health is the largest local public health agency in Canada • Mandate: programs and services that contribute to the health and well-being of residents What has changed in 10 years? 2004 Today Health Impacts of Air Pollution • Air pollution in Toronto from all sources currently gives rise to 1,300 premature deaths and 3,550 hospitalizations annually • This represents a decrease of 23% in premature deaths and 41% in hospitalizations as compared with 2004 estimates Prepared by: Toronto Public Health Health Impacts of Local Air Pollution • Traffic is the most significant local source of air pollution and resulting burden of illness • Other sources also contribute to the overall burden of illness from air pollution Premature Deaths Hospitalizations Pyramid of Health Effects from Traffic-Related Air Pollution Year 2012 2011 2010 2009 2008 2007 2006 2005 2004 2003 2002 2001 2000 1999 0.8 0.7 0.6 0.5 0.4 0.3 0.2 0.1 0.0 Year Year Annual average O3 30.0 25.0 20.0 15.0 10.0 5.0 0.0 2012 2011 2010 2009 1.0 2008 Year 2007 Annual average CO 2006 Year Annual average PM2.5 0.9 12.0 10.0 8.0 6.0 4.0 2.0 0.0 2012 2011 2010 2009 2008 2007 2006 2005 2004 0.0 2003 0.5 2005 1.0 2002 1.5 2001 2.0 2004 2.5 2000 4.5 2003 3.0 1999 3.5 Concentration of NO2 (ppb) 5.0 2002 2012 2011 2010 2009 2008 2007 2006 2005 2004 2003 2002 2001 2000 1999 Concentration of SO2 (ppb) Annual Average SO2 Concentration of PM2.5 (mg/m3) 2012 2011 2010 2009 2008 2007 2006 2005 2004 2003 2002 2001 2000 • Levels since 2009 have stagnated or may be increasing Concentration of CO (ppm) • Most pollutants show steady decline since 2000 Concentration of O3 (ppb) Toronto Air Quality Over Time Annual average NO2 35.0 4.0 30.0 25.0 20.0 15.0 10.0 5.0 0.0 Actions make a Difference Canada-Wide Standards for Particulate Matter and Ozone Photo: Hmvh1 Commuting Trends Active Transportation Heavy Truck Emissions Highways • Nitrogen Oxide levels across Toronto are especially high near major highways Energy Efficiency • Emissions related to natural gas combustion are related to about 28% of premature deaths and 20% of hospitalizations arising from air pollution emitted with Toronto's borders Photos: Andreas Meck Gigantichound SimonP Industrial Emissions • Air pollution from large industries contributes to 18% of premature deaths and 10% of hospitalizations from air pollution emitted within Toronto Local Variation in Air Quality • Burden of illness numbers are averages for Toronto • Air Monitoring and Air Modelling are tools that can help provide information at the neighbourhood scale Photo: Martin Cathrae Key Policy Recommendations • Ontario to fund municipal transit and active transportation infrastructure to reduce air pollution emissions in Toronto and the GTHA; • ensure that all Metrolinx "Big Move" projects incorporate safe infrastructure for pedestrians and cyclists to encourage travel that reduces air pollution emissions; • the City of Toronto develop an urban freight strategy to improve efficiency and co-ordination of heavy-duty vehicles which often have high emissions; • the City of Toronto explore design solutions to mitigate impacts of highway emissions on nearby residential areas; • improve access to air monitoring equipment that can measure air pollution levels on and near roads by sharing costs with neighbouring municipalities and the provincial government. Next Steps • City Council May 6-7 2014 • Provincial Election? For more information sgower@toronto.ca www.toronto.ca/health/reports
