View Presentation - CMIA, Aurangabad
advertisement

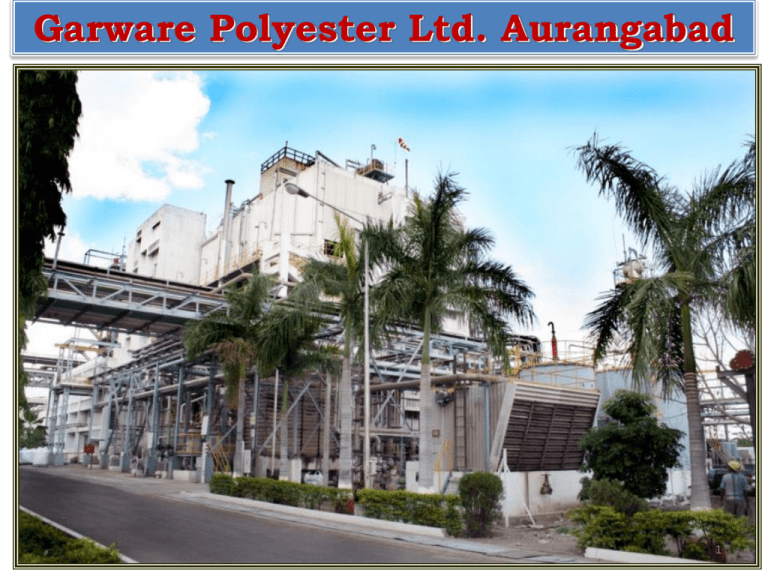
Garware Polyester Ltd. Aurangabad 1 Company Profile 2 Unit Profile Garware Polyester Limited is the pioneer in the field of polyester film. The Company has developed various types of films and is exporting to 57 countries in World. The company has excellent infrastructure and strong commitment to Safety, Quality, Energy Conservation , Environment preservation and R&D. Winner of Highest Export Award-Plex council (Govt. of India, Ministry of Commerce) since last 20 years. Winner of “Energy Efficient Unit- 2010” by CII. Winner of 1st award in 2009 in “Plastic Category” on National Level (NECA) Winner of 2nd award for excellence in Energy Conservation and Management in 5th Maharashtra State Level Award competition in year 2008 in category “Other Industries“. The company has set up cross functional Energy Conservation Cell, which focuses on energy management and improvement. The company recognizes the importance of energy conservation, not only to improve the bottom line but also to help the environment and society at large for sustainable growth. 3 Process Flow Diagram 4 5 6 ENCON 7 Energy Management Policy Garware Polyester Limited plays vital role for producing variety of products with high level of quality standard and prioritizes energy value for the final product. Our mission is : To produce products with minimum use of energy. Use of cleaner technologies wherever possible and ensuring efficient and uninterrupted supply of utilities to plants. This, we plan by following ways. Efficient energy generation, utilization and distribution. Continuous evaluation of performance of plant equipments and processes to achieve most efficient, high standard quality products. Targeting the under-performance equipments and processes for improvement. Monitoring and targeting the specific energy consumption to achieve best possible as compared to past performance. Use of internal and external expertise to achieve targeted performance. Train employees and implement ideas of energy conservation thorough small ENCON teams. M S Adsul Director-Technical 8 ENCON Team Structure DIRECTOR - TECHNICAL ENGINEERING HEAD DY. GENERAL MANAGER CENTRAL UTILITY ENCON TEAM FILM PLANT ENCON TEAM POLYMERISATION PLANT ENCON TEAM CENTRAL UTILITY ENCON TEAM CHIKALTHANA PLANT 9 Energy Monitoring • 1.Daily Energy report is generated by Central Utility on daily basis and circulated to all concerned. • 2.Monthly Based on daily energy report, monthly energy report is prepared and circulated to all concerned. Comparison & analysis of energy consumption is done with previous months and deviations are studied for reduction in Energy Bills. • 3.Yearly Yearly reports generated from data collected as above. Specific energy consumptions are calculated and targets are set for future. Major ENCON projects are listed in annual report. 10 ENCON Methodology 1. Identification of high energy consuming equipments/processes through internal & external audits. 2. Elimination of inefficient equipment & substitution with new & efficient technologies. 3. Continuous energy performance monitoring through statistical analysis. 4. Brainstorming in small group activities for innovative ideas. 5. Reduction in Carbon foot print & implementation of green projects. 6. Benchmarking with other competitors. 7. Involvements of employees through suggestion schemes & competitions. 11 1. Failure losses - Breakdown loss 2. Setup / adjustment losses 3. Cutting blade loss 4. Start up loss 5. Minor stoppage / Idling loss. 6. Speed loss - operating at low speeds. 7. Defect / rework loss 8. Scheduled downtime loss 9. Management loss 10. Operating motion loss 11. Line organization loss 12. Logistic loss 13. Measurement and adjustment loss 14. Material Yield loss 15. Energy loss 16. Die, jig and tool breakage loss 12 ENCON IMPLEMENTED PROJECTS 13 ENCON PROJECTS 2008-09 S. No. Achievement of energy savings per year basis Project description 1 2 3 4 5 6 7 8 Provision of VFD for VAHP Cooling tower Fan.Central Utility, Waluj. Convertion of VAHP m/c.from single effect to double effect. Central Utility, Waluj. Commissioning of 40TR & 100TR VCC Chiller m/c. C.U. Waluj. Convertion of Boiler from furnace oil to Biocoal firing. Central utility, Waluj. Provision of cooling water to poly plant cutter instead of chilled water. Poly Plant, Waluj Optimisation of ejector cooling tower. Poly Plant, Waluj. Palletizing return water pump replaced by high efficiency pump. Film Plant, CHK. K.G.Khosla compressor operation stopped by taking portable compressor in line. Film Plant, CHK. Sub Total Electricity F.Oil (Lakhs (kWh) (KL) 0.52 Investment incurred on the project (Rs. Lakhs) Others Total savings in (Rs. Lakhs) 0 0 1.81 0.20 0 1123.12 0 207.55 60.00 -10.58 313.60 0 20.91 4.00 0.00 231.52 0 42.78 0.20 0 528 0 97.57 0.50 5.04 0 0 17.64 0.50 0.35 0 0 1.23 0.30 1.20 0 0 4.20 0.00 -3.48 2196.24 0.00 393.70 65.7014 ENCON PROJECTS 2009-10 Year of S. No. Project description Commissi oning of the projects 2009-10 1 Installation of high efficiency screw chillers 2 Commissioning of H.P.Ejectort Achievement of energy savings per year basis Electricity F.Oil Others (Lakhs (kWh) (KL) -12.60 0 1130 580.00 0 0 Total savings in (Rs. Lakhs) 219.09 138.97 Investment incurred on the project (Rs. Lakhs) 71.00 80.00 3 Optimisation of compressed air system. 3.03 0.00 0 12.42 0.00 4 Optimisation of chilled water system. 3.03 0.00 0 12.42 0.00 5 Provision of VFD to boiler F.D. fan 1.34 0 0 5.49 2.00 6 1.00 0 0 4.10 0.00 7 Replacement of 150 H.P. blower motor with 75 H.P. motor VFD to biopeq feed pump in ETP 0.67 0 0 2.75 2.00 8 Aeropeq blower speed reduction in E.T.P. 0.58 0 0 2.38 0.08 9 VFD to C.W. return sump in Polyplant 0.67 0 0 2.75 2.00 10 EIL heater efficiency improvement. 0.00 70 0 16.77 10.00 -2.28 1780.00 0.00 417.14 167.08 Sub Total 15 ENCON PROJECTS 2010-11 Year of S. No. Commissionin g of the projects 1 2 Project description EIL heater efficiency optimization. Central Utility, Waluj. Polyplant cutter cooling tower. Achievement of energy savings per Investment year basis incurred on the project Electricity F.Oil Others Total savings in (Rs. Lakhs) (Lakhs (MT) (Rs. Lakhs) (kWh) 0.00 69.3 0 15.43 11.00 7.2 0.00 0 29.38 15.00 0.00 51.04 0 11.37 0.00 2.38 0.00 0 9.69 0.00 0.00 1800.00 0 91.26 332.41 6 Direct transfer of condensate from Glycol Recovery to De-aerator. Stopping of MDO chilled water system and hook up from Central Utility. Commissioning of Biomass fired Boiler. p.f. incentive at Waluj. 0.00 0.00 0 169.30 0.00 7 p.f.incentive at Chikalthana 0.00 0.00 0 76.69 0.00 8 Use of emulsified F.O. for Thermic fluid heater in CHK plant Provision of VFD to TDO oven blower.in CHK plant Secondary hot oil pump impeller trimming in CHK plant. Sub Total 0.55 0.00 0 2.26 1.50 0.24 0.00 0 0.97 1.50 0.10 0 0 0.40 0.10 10.47 1920.34 0.00 406.76 361.51 3 4 5 2010-2011 9 10 16 ENCON PROJECTS 2011-12 Year of S. Commissio No. ning of the projects 2011-2012 Project description Achievement of energy savings per year basis Electricity F.Oil (Lakhs (kWh) 0.00 (KL) 69.3 0 18.04 11.00 0 0.00 448 21.50 8.00 3 Direct transfer of condensate from Glycol recovery to deaerator, Waluj. 4 Conversion of Aluminum blade to FRP blade for cooling tower fan (Waluj) 0.00 0.00 200 9.60 0.00 0.25 0.00 0 1.10 1.00 5 Provision of booster compressor for instrument air system (Waluj) 2.52 0.00 0 10.99 1.00 6 p.f. Incentive at waluj 7 p.f. Incentive at Chikalthana 0.00 0.00 0.00 0.00 0 0 190.44 84.95 0.00 0.00 8 Commissioning of 110 TR chiller & reducing VAHP load (Waluj) -5.91 0.00 1000 22.23 12.00 9 Operation of separate 13TR chiller for Kappa cooler stopped by transferring load to primary chilled water system. (Chikalthana) 1.85 0.00 0 8.06 8.06 10 Pneumatic booster installed & stopped operation of portable compressor. (Chikalthana) 0.34 0 0 1.46 0.50 11 Return water pump for twin screw vacuum system operation stopped by using gravity flow system. (Chikalthana) 0.17 0 0 0.73 0.00 12 Energy Efficient lighting used in L#2 TDO & slitter area. Total – 45 Nos (Chikalthana) 0.08 0 0 0.34 0.34 13 Rotary feeder installed at L#1 instead ventury system. (Chikalthana) 14 Replacement of 125W HPMV lamps by 23W CFL-60 nos. (Waluj) 1.01 0 0 4.39 0.50 0.27 0 0 1.17 0.50 1 Thermal Fluid Heater (EIL) efficiency optimization. Central Utility, (Waluj) 2 Waste heat recovery from boiler flue gases.(Waluj) Sub Total 0.58 Others Investment incurred on Total savings in the project (Rs. Lakhs) (Rs. Lakhs) 69.30 1648.00 375.00 42.90 17 ENCON PROJECTS 2012-13 Achievement of Annual energy savings in 2012-13 Investm Year of Commission S.NO. ing of the projects 2012-2013 Project description ent incurred Fuels* Total on the savings project F.Oil Gas Total in (Rs. (Lakhs Coal Rs. (lakh (fuel) in Lakhs) (Lakhs) kWh) (tonnes) (kL) 3 Nm ) (MTOE) Electrici ty 1 Optimisation of Cooling tower pumps (at waluj) 7.35 0 0 0 0 44.06 0.5 2 Optimisation of chilled water pumps. (At waluj) 5.37 0 0 0 0 26.99 0.5 3 Optimisation of Therminol pumps. (at waluj) 3.1 0 0 0 0 19.2 0.75 4 Power factor incentive (at waluj) 0 0 0 0 0 277.66 0 5 Replacement of Cooling tower fan blades with FRP blades (at waluj) 0.15 0 0 0 0 0.76 0.75 6 Complete stoppage of FO Boiler (at waluj) 0 0 38.4 0 36.66 12.83 0 7 Replacement of Condenser water pump by low head. (chikalthana) 1.34 0 0 0 0 6.75 0.45 8 Provision of Rotary feeder for chips conveying instead of ventury system. (chikalthana) 1.01 0 0 0 0 5.07 1.2 9 Water Emulsification of furnace oil. (chikalthana) 0 0 81.66 0 77.96 27.3 9.5 10 Twin screw return water pump stopped by using gravity flow system. (chikalthana) 0.25 0 0 0 0 1.26 0 11 L#2 AHU No-3 water pump replaced by energy efficient pump. (chikalthana) 0.42 0 0 0 0 2.11 0.2 12 Power factor incentive (at chikalthana) 0 0 0 0 0 98.87 0 16.68 0 120.06 0 SUB TOTAL 114.63 500.5 18 13.85 ENCON SUMMARY - LAST 5 YRS YEAR No. of Measures implemente d (i) Investment made (Rs. Lakhs) (ii Savings achieved (Rs. Lakhs / year) (iii) Energy Cost (Rs. Lakhs/ year) (iv) % Savings of Energy Cost (iii /iv x 100) 2008-2009 8 65.70 393.7 4730.70 8.32 2009-2010 10 178.00 417.14 5216.91 10.17 2010-2011 10 360.71 406.76 5025.71 8.28 2011-2012 10 42.9 375.00 5599.59 6.69 2012-2013 12 13.85 530.5 6407.11 8.30 19 Energy Reduction – Chips Plant Chips - Specific Electrical Energy - kWhr/MT 300 290 280 270 260 6.88% 3.29% 291.8 250 3.24% 271.76 1.92% 254.29 249.42 2011-2012 2012-2013 262.81 240 230 220 2008-2009 2009-2010 2010-2011 Chips - Specific Thermal Energy - Mkcal/MT 1.6 1.4 1.2 10.42% 6.12% 1 11.64% 0.8 1.4 0.6 1.29 5.61% 1.21 1.07 1.01 2011-2012 2012-2013 0.4 0.2 0 2008-2009 2009-2010 2010-2011 20 Energy Reduction – Film Plant Film - Specific Electrical Energy - kWhr/MT 1200 1150 5.46% 1100 1050 1180.5 7.5% 1116.06 1000 950 0.2% 0.87% 1032.60 1030.49 1021.56 2010-2011 2011-2012 2012-2013 900 2008-2009 2009-2010 Film - Specific Thermal Energy - MkCal/MT 1.6 1.4 18.91% 1.2 16.8% 1 -1.1% 0.8 1.7% 1.4 0.6 1.20 1.00 1.01 0.99 2010-2011 2011-2012 2012-2013 0.4 0.2 0 2008-2009 2009-2010 21 INNOVATIVE PROJECTS 22 ENCON Project : 1 Title : Poly Plant Cutter Cooling Tower • Loss no: 15 • • Background of the project : To reduce chilled water load. Observation made : o Chilled water is used for Poly plant cutter for cooling of chips from 280°C to 40°C. o Cooling water can also be used for cutter cooling. • Technical and Financial Analysis Investment : Rs. 15 Lacs Implemented : Aug. 2009 1st year cost Saving : Rs. 29.38 Lacs Impact of implementation : Reduction in chilled water load by 200 TR/Hr. • On annual basis Energy consumption before : Energy consumption after : Electricity cons. (Lacs kWh) 9.81 2.61 23 Before After 24 25 Process Flow Diagram of Chilled Water System Chilled water out Cooling water out Film Plant VAHP MACHINE Cooling water in Chilled water in Poly Plant Batch Plant Pump Chilled water return from plants 26 Single effect Machine Steam consumption single effect machine = 8.1 Kg/TR 27 Double Effect Machine Condensor High Temp. Generator Low temp. generator Over flow pipe Cooling Water Evaporator Absorber Purge Pump Diluted Solution Inter Solution Concentrated LiBr Refrigerant Chilled Water Cooling Water Refrigerant Vapour Steam/ Flue Gases Steam consumption Double effect machine = 4.1 Kg/TR 28 Cost Saving Table Single Effect Machine Double Effect Machine Steam consumption 8.1 Kg/TR 4.1 Kg/TR Cost of Steam Rs. 737 Lacs /Annum 373 Lacs /Annum Cost Saving (fluctuates as per FO Price) 364 Lacs / Annum 29 Machine Photographs Single Effect Machine - Before Double Effect Machine - After 30 ENCON Project : 3 • Title : Commissioning of Biomass Fired Boiler • Loss No- 15 • Background of the project : To reduce Furnace oil consumption for Boilers. • Observation made : • Cost of steam on briquette is almost half that of F.O. • Unused IAEC make F.O. fired boiler of 18 MT/Hr capacity is available. • Can be used by installing external furnace for biomass firing. • Existing underutilized go down can be used for boiler operation and briquette storage. • Technical and Financial Analysis : • Investment : Rs. 332 Lacs • Implemented : Jan. 2010 • Impact of implementation :Reduction in Furnace Oil consumption. • Thereby reduction in SO2 by 108000 Kg/annum and estimated reduction in CER by 11000 per annum. 31 Avg. Furnace oil Reduction = 200 MT/M Average Cost of Furnace Oil = 34500 Rs./MT Yearly Cost savings (Fluctuate as per Price variation in the Fuel) = 183 Lacs/Year 32 33 Briquette Fired Boiler 34 F.O. Fired Boiler Biomass Fired Boiler after conversion 35 Percentage Renewable Energy Before KAIZEN Implementation FURNACE OIL 100% Percentage Renewable Energy Utilisation For Steam Generation After KAIZEN Implementation 15, 15% 85, 85% Furnace Oil Briquettes 36 ENCON Project : 4 • • • • • • • • • Title :Optimization of Cooling water system Loss no- 15 Background of the project : To reduce power consumption for Cooling water pumping. Observation made : 1. Cooling water high head and low head requirement areas were identified. 2. It was observed that high head heat exchangers were starving due to low pressure although the flow through pumps was satisfactory. 3. The low head areas were provided with positive isolation wherever possible to reduce the unnecessary power consumption and other heat exchangers were tuned for appropriate diff temp for optimum flow. Technical and Financial Analysis : Investment : 0.5 Lacs Implemented : Dec. 2012 1st year cost Saving : Rs. 44.06 Lacs Impact of implementation : Reduction in power consumption—5.04 LkWh per annum 37 Sample Calculation Equipment Main process cooling DG cooling tower tower pump no 1 pump no 2 Time KW KVA KVAR PF VOLTS AMPS FREQUENCY 17.45 246.2 275.08 0.895 404.2 394 50.02 13.20 33.38 37.76 17.65 0.883 395.2 55.87 49.77 DG cooling tower pump no 3 13.30 41.61 45.97 19.12 0.904 395.8 67.91 49.84 Main process cooling tower pump no 2 11.5 161.6 191.3 102.3 0.843 414.8 264 49.65 Previous condition : Pumps running : PCT pump no.1 and DGCT pump no. 2 & 3 After optimisation : Pumps running : PCT pump no. 2 only For saving we have considered the difference in KW of PCT pump no.1 and 2 KW saved = 246 – 161 = 85 KWH Saving in Rs . = 85 x 24 x 30 x 5. = Rs. 3.67 lacs / Month = Rs. 44.06 Lacs / Annum 38 ENCON Project : 5 • • • • • • • Title :Optimization of chilled water system Background of the project : To reduce power consumption for Chilled water pumping. Observation made : 1. Chilled water high head and low head requirement areas were identified. 2. It was observed that high head heat exchangers were starving due to low pressure although the flow through pumps was satisfactory. 3. The expansion tank of the system was raised by 8 M of height to improve the suction and discharge head. 4. The low head pumps were put into operation to reduce the power consumption. 5. All heat exchangers were tuned for required chilled water flow. Technical and Financial Analysis : Investment : 0.5 Lacs Implemented : Dec. 2012 1st year cost Saving : Rs. 26.99 Lacs Impact of implementation : Reduction in power consumption---5.37LkWh per 39 annum. Sample Calculation Chilled water system Pump. no.1 pump no.2 Total pump no.3 KW KVA KVAR PF VOLTS AMPS FREQUENCY 70.05 76.33 29.19 0.921 407.5 107.6 50.09 33.7 ,-,-,-,-,-,-- 103.75 39.13 29.66 25.15 0.754 Lag 410.4 54.72 49.38 Previous condition : Pumps running : pump no.1 and 2 After optimisation : Pump running : pump no. 3 only ( Pump replaced ) KW saved = 103 – 39 = 64 KWH Saving in Rs . = 64 x 24 x 30 x 5.85 = Rs. 2.69 lacs / Month = Rs. 26.99 Lacs / Annum (for 300 Days/year) 40 ENCON Project : 6 • • • Title :Optimization of Hot oil system Background of the project : To reduce power consumption for Hot oil pumping. Observation made : 1. Hot oil high head and low head requirement areas were identified. 2. It was observed that high head heat exchangers were starving due to low pressure although the flow through pumps was satisfactory. 3. Thermic fluid heater coil flow made fine tuning. 4. Before implementation one high head pump was running with full impeller, after that two pumps impeller trimmed & reduced the head & increased the flow . Technical and Financial Analysis : • Investment : 0.5 Lacs Implemented : Dec. 2012 • 1st year cost Saving : Rs. 19.2 Lacs • Impact of implementation : Reduction in power consumption---3.1 Lac kWh/annum 41 Sample Calculation Equipment Time KVA KW KVAR PF VOLTS AMPS FREQUENCY Primary santotherm pump no 1 12.45 105.9 98.29 39.3 0.927 409.5 149.9 49.85 Primary santotherm pump no 3 12 106 99.02 39.8 0.928 410 150 49.75 Primary santotherm pump no 2 Total 197.31 13.40 Hrs 254.8 235 56.44 0.922 408 353 49.79 Previously condition : Only pump no. 2 in line After optimisation : Pump no. 1 & 3 in line. NET KW SAVED = 235 – 198 = 35 KWH SAVING IN Rs. = 35 x 24 x 30 x 6 = Rs. 1.6 Lacs / Month = Rs. 19.2 Lacs / Annum 42 Efforts on Electrical Energy reduction • Utilization of High efficiency motor for blower. • Blower old motor efficiency was lower i.e 88%. • Before implementation blower motor taking 18.18 Kwh & with high efficiency motor 14.92 Kwh . • Cost Saving : Rs. 1.69 Lacs • Impact of implementation : Reduction in power consumption---0.3Lac kWh/annum 43 Sample Calculation BALDOR HIGH EFFICIENCY MOTOR TRIAL AND COMPARISION WITH NORMAL MOTOR ENERGY READINGS WITH THE HELP OF ENERGY MGR.(DATE-09/05/07,TIME- 17.15 Make Type Hz M/C No Duty Amps Kw P.F. - TRIM SUCTION BLOWER NO - 01 BBL 3Ph I.M. 1LAJO872 FR 160L 50 Ins cl B K4610292 S1 V 415 Delta 33 18.5 0.83 Eff. RPM - Valve position on - 3 MEASUR E AVG R V A F Wh Vah VARh PF 402.3 28.36 50.2 18.18 20.19 7879 0.917 88% 2920 Y RY-400.7 YB-401.8 28.04 28.77 6088 6772 2818 0.904 TRIM SUCTION BLOWER NO - 03 Make Baldor FR D160 6131 6571 2281 0.932 B BR404.8 29.7 6280 6877 2784 0.914 Kw Amps ENCL Ins. Cl Nima Eff Rating Sr No - 18.5 30 TEFC F AVG R 400.7 22.6 50.18 14.92 16.03 5542 0.936 V RPM Hz SER. F - 415 2915 50 1 93% IP 45 C AMB Z0605110010 Usable at 208 V Valve position on - 3 Y RY-401.8 YB-401.1 22.34 23.07 5002 5426 1924 0.926 5028 5416 1897 0.932 55 CONT B RB-399.4,Ln231.7 21.63, N - 1.83 4904 5252 1720 0.942 44 Efforts on Electrical Energy reduction • Conversion of motor connections from delta to star. • Methanol recovery cooling tower fan motor connections changed from delta to star reducing power by 0.16 kwh Calculation: (1.78*24*30*12/100000)*6 • Total Cost Saving : Rs. 1.00 Lacs • Impact of implementation : Reduction in power consumption---0.15Lac kWh/annum 45 Sample Calculation DELTA TO STAR CONVERSION SR NO 1 2 NAME OF EQIPMENT MEOH RECOVERY COOLING TOWER FAN NO 1 MEOH RECOVERY COOLING TOWER FAN NO 2 MOTOR RATING KW KV NET NET SAVI AR ENER DEM DELT NG SA GY AND STAR A VIN SAVIN SAVI G G PER NG MONT VAH WH VARH PF AMP FREQ VAH WH VARH PF AMP FREQ H ENERGY PARAMETER 11 KW, 1500 6758 4497 5029 0.667 9.49 49.68 4768 4339 1962 0.91 6.6 50.3 0.16 3.07 113 RPM 11 KW, 1500 6976 4849 4971 0.72 9.48 50.05 5055 4633 2086 0.90 7.2 49.7 0.22 2.47 155 RPM 1.95 1.6 DMT SCRUBBER PUMP 3.7KW, 3000 1732 929.3 1426 0.537 2.42 49.88 983.8 828 420 0.85 1.6 50.0 0.10 0.95 72.72 0.756 RPM REBOILER PUMP 7.5 KW, 3000RP 3984 2812 2715 0.71 5.652 49.51 3011 2782 1131 0.91 4.0 49.7 0.00 1.59 2.16 M 3 0.93 4 46 Sample Calculation DELTA TO STAR CONVERSION SR NAME OF EQIPMENT MOTO NO R RATIN DELT A G KW KV NET NET SAVI AR ENER DEM STA NG SA GY AND R VIN SAVIN SAVI G G PER NG VAR FRE VAR FRE VAH WH PF AMP VAH WH PF AMP MONT H Q H Q H SEC EI PUMP 5 MEOH FEED PUMP NO 2 ENERGY PARAMETER 5.5 KW, 3017 1191 2729 0.39 4.97 49.8 1255 965.3 742 0.77 1.07 50.1 0.23 1.8 3000 RPM 162 1.792 3635 2598 2512 0.71 406 49.5 2551 2403 775 0.94 3.58 49.8 0.20 1.6 140.4 1.087 6 7 CASTING COOLING 9.3KW, TOWER FAN 1500R 5634 4169 3808 0.73 7.08 49.7 4404 3934 1853 0.90 6.92 49.4 0.24 1.9 169.2 1.313 PM PACKING AHU 11KW, 1500 RPM 8461 6362 5555 0.75 11.51 50.2 6409 5716 2857 0.89 9.75 49.3 0.65 4.4 465.12 2.060 8 47 List of Awards Sr. No. 1 2 Awards Title 5th State Level For Excellence in Energy Conservation and Management National Energy Conservation Award-2009 Organized by MEDA Year Winner Category 2008 Second Award in Other Industries. BEE 2009 First Award in Plastic Sector. 3 CII – Energy Efficient Unit CII 2010 Energy Efficient Unit 4 CII – National Award for Excellence in Energy Management 6th State Level For Excellence in Energy Conservation and Management 7th State Level For Excellence in Energy Conservation and Management CII 2011 Excellent Energy Efficient Unit MEDA 2012 Certificate MEDA 2012 Certificate 5 6 48 49


