1 - Schatz - Saint Joseph`s University
advertisement
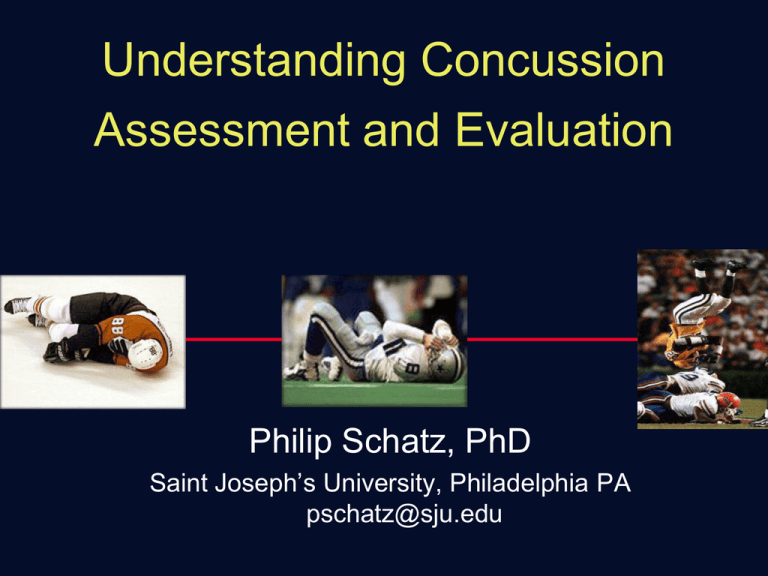
Understanding Concussion Assessment and Evaluation Philip Schatz, PhD Saint Joseph’s University, Philadelphia PA pschatz@sju.edu Cerebral Concussion • Mild traumatic brain injury • Alteration in consciousness due to a blow to the head or acceleration/deceleration/rotational force • Does NOT imply or require loss of consciousness. • Usually temporary changes in mental status • Temporary changes in somatic functioning • May produce a wide range of symptoms • Normal structural neuroimaging CISG, Vienna (2001); Prague (2004) Post Concussion Symptoms “Oh man… I was licking the dreamsicle” -- Professional wrestler, reflecting on a concussion Head Games Chris Nowinski Post Concussion Symptoms “Physical”: • Pressure in head • Headache • Balance troubles • Visual Disturbance • Numbness • Tingling • Feeling slow • Sensitivity to light/noise “Psychological”: • Feeling like in a “fog” • Difficulty concentrating • Difficulty remembering • Irritability • Sadness • Nervousness COMMONLY REPORTED SYMPTOMS High School/University Athletes within 3 days of injury Headache (71%) Feeling slowed down (58%) Difficulty concentrating (57%) Dizziness (55%) “Fogginess” (53%) Fatigue (50%) Visual Blurring or double vision (49%) Light sensitivity (47%) Memory dysfunction (43%) Balance problems (43%) Physiological Changes • Shearing or strain injury of axons • Diffuse microscopic changes to axons • Microscopic tearing of small blood vessels • Metabolic cascade resulting in imbalance between glucose demands and regional CBF supply (vulnerable to SIS) Giza & Hovda, JAT, 36(3), 228-35 Neurometabolic Changes Incidence of Mild TBI 75 to 85 % of all head injuries 1.0 to 1.5 million cases per year in US 300,000 from sports (an underestimate?) Most cases go unreported Incidence of Mild TBI Question: What sport has the highest incidence of concussion (if you know, don’t say it) Previous Findings: Epidemiology • By Sport: SPORT Equestrian Boxing Rugby Soccer Football Bicycling Martial Arts Auto Racing Ice Hockey % RANGE 3 - 91 1 - 70 2 - 25 4 - 22 2 - 20 0 - 13.8 0 - 11 0 - 10.5 3 - 7.5 Ruchinskas, et al., 1997, Applied Neuropsych Epidemiology: Issues (Macciocchi) – Recognition one occurred may be easier then measuring concussion severity – Diagnosis for epidemiological purposes may be more difficult than it seems • Discrepancy between # of players reporting and the # who believed they sustained one • Post-season, players reported symptoms but didn’t connect them to concussive injuries • 70% of football and 63% of soccer players reported postconcussion symptoms Epidemiology: Methods (Macciocchi) – Quasi-experimental comparison- athletes examined pre-season, followed for a period of time • Look at # of concussions sustained over that period • Generalize from cohort to population – Use date from “surveillance systems” • Monitor concussive injuries on a broader scale • Sometimes are organization-based, such as NCAA Epidemiology: Terminology (Macciocchi) – Athletic Exposure (AE) • Period of time when an athlete could have sustained an injury, such as practice or game • Confounded by time (a 5-minutes shift is the same as an entire game) – Injury Rate (IR) • Number of injuries incurred relative to the total number of exposures • Often stated as “per 1000 AE’s” Epidemiology: High School – 20% or 250,000 per year in football (Gerberich, et al. 1985) – 25,520 per season (Powell, 1995) – NATA High School Study – – – – – – 57,716 occurrences of mTBI per year 5.3% of football injuries 4.4% of wrestling injuries 3.4% of boys soccer 2.6% girls soccer 2.3% girls basketball Epidemiology: NCAA • College: NCAA Injury Surveillance System – – – – – – – 1.6 to 6.4% of all injuries Ice Hockey - 4.5% of all injuries (.56 per 1,000 AE) Football .43 per 1,000 AE Wrestling .49 per 1,000 AE Soccer (Men = .35/Women=.58) Lacrosse (Men= .33/Women=.62) Basketball (Men=.16.Women=.29) Concussion Base Rates • History of Previous Concussion: 10-80% • Recent Trend Upwards: (% with 1+ Previous Concussion) – Collins, et al (1999) 53% – Kaushik (2005) 75% – Moser, Schatz, Jordan (2005) 63% • Different “breed” of youth athletes in 2000’s vs. 1980’s? What about Gender? Hillary, Mann, Schatz, ACN, 2002 Study Powell, Barber-Foss Powell, Barber-Foss Powell, Barber-Foss NCAA Study Dick Dick Boden, et al. NCAA Powell, Barber-Foss Powell, Barber-Foss Powell, Barber-Foss J. Kelly, J. Rosenberg Sport (% of All Injuries) Soccer Basketball Baseball/Softball Soccer Males 3.9% 2.6% 1.7% 4.7% Females 4.3% 3.6% 2.7% 4.4% Total % of all injuries 3.23% 3.75% Sport (Injuries per 1000 AE) Soccer Lacrosse Soccer Soccer Soccer Basketball Baseball/Softball Soccer Males 0.348 0.334 0.6 0.44 0.18 0.11 0.05 0.25 Females 0.578 0.618 0.4 0.46 0.23 0.16 0.1 0.24 Total Ave per 1000 AE Soccer Ave per 1000 AE Other Ave per 1000 AE 0.289 0.364 0.165 0.348 0.382 0.293 Epidemiology: Gender Covassin, Swanik, Sachs, JAT, 2003) NCAA Injury Surveillance System: 3-year study • Of 14,591 reported injuries, 5.9% were classified as concussions Concussions during practices: Female athletes: Male athletes 167 (3.6%) 148 (5.2%) Concussions during games: Female athletes: Male athletes: 304 (9.5%) 254 (6.4%) Epidemiology: Gender Covassin, Swanik, Sachs, JAT, 2003) Barnes, et al, 1998, Am J Sports Med: • Female athletes could be at more risk due to their smaller size or greater ball-to-head size ratio. • Female athletes may have weaker neck muscles than male athletes. Boden et al, 1998, Am J Sports Med: • Male athletes may be more skilled at protecting their heads from injury, but there are no data to support this hypothesis. Gender Differences at Baseline 1209 NCAA Division 1 Athletes - 5 Northeastern Universities • Completed ImPACT at baseline • Female athletes performed significantly better than male athletes on baseline verbal memory scores (p = 0.001) • Male athletes performed significantly better than female athletes on baseline visual memory scores (p = 0.001). Covassin, Swanik, Sachs, Kendrick, Schatz, Zillmer, Kaminaris, (BJSM, 2007) Gender Differences at Baseline Female athletes endorsed a significant number of mild baseline symptoms as compared to male athletes: • Headache, nausea, fatigue, need more sleep, drowsiness, sensitive to noise, sadness, nervousness, more emotional, difficulty concentrating, visual problems. • Effect sizes ranged from .13 (Sleep) to .40 (Emotional) Covassin, Swanik, Sachs, Kendrick, Schatz, Zillmer, Kaminaris, (BJSM, 2007) Recommended schedule for measuring post-concussion status NP Sideline RETURN TO Testing Testing PLAY? BASELINE NP TESTING INJURY PRE-SEASON 1-2 DAYS AFTER INJURY Historical Aspects: UVA Football Study - Barth, et al., 1989 Trail Making B: Pre-Season and Post-Injury Performances Historical Aspects: Neuropsych Measures-Trails B Historical Aspects: Neuropsych Measures-Digit Symbol Historical Aspects: Neuropsych Measures - PASAT Historical Aspects: Neuropsych Measures - COWAT Tell me as many words that you can think of that start with the letter… F…A…S. Historical Aspects: Neuropsych Measures - STROOP Historical Aspects: Neuropsych Measures - STROOP Historical Aspects: Neuropsych Measures - STROOP Historical Aspects: Neuropsych Measures - STROOP Historical Aspects: UVA Football Study - Barth, et al., 1989 PASAT-4: Pre-Season and Post-Injury Performances Historical Aspects: Echemendia PSU: Hockey: COWAT % Relative to Baseline 20 0 Baseline 2 Hour 48 Hour 1 Week -20 -40 -60 Concussed Control 1 Month Historical Aspects: • Egocentric view: – The Virginia Football Study – Echemendia’s PSU Program – Saint Joseph’s University • Division I, No Football, 400+ varsity athletes – Where can I find a place? – Computers circa 1998 What We Knew: 2000 • Effects of Cerebral Concussions last up to 7-10 days – Primarily attention and concentration Alves, Rimel, Nelson, 1987, Clinical Sports Medicine, 6(1), 211-8 Barth, et al., 1989, in H. Levin’s Mild Head Injury: Oxford Press • Effects of cerebral concussions last up to 30 days and beyond (Echemendia, et al., 1999) – Extends to other cognitive processes Echemendia & Julian, 2001, NP Review 11(2), 69-88 What We Knew: 2000 • LOC is not a predictor of concussion, and incidence of LOC does not effect cognitive performance (Lovell, et al, J. Clin Sports Med, 1999) • Individuals with history of Concussion and/or Learning Disability show lowered baseline performance on testing. (Collins, et al., JAMA, 1999) Current Research: How do I develop a Concussion Program at SJU? (Hopefully) based on Professional and Collegiate Concussion Management Programs • • • • • NFL - Majority NHL - Mandatory Baseline, Serial Post-concussion Evals. Wide Network of Neuropsychologists Colleges test teams pre-season SJU Concussion Pilot Study: Trails B SJU Concussion Pilot : Digit-Symbol SJU Concussion Pilot Study: d2 There already was a trend towards computer-based assessment • CRI (HeadMinder.com)…………. 1999 – Web based • CogSport (CogState.com)………..1999 – Windows/Mac • ImPACT (ImPACTtest.com)……. 2000 – Windows based Why should we opt for computer-based assessment? • Sensitive to RT, Processing Speed • Randomized Trials: Improved reliability • Ability to test entire team at once (benefit?) • Better/Objective date for Athletic Trainers, Team Physicians • Assistance with Return to play decisions (Schatz & Zillmer, 2003, Applied Neuropsych; Schatz & Browndyke, 2003, JHTR) Why should we not opt for computer-based assessment? • Perhaps timing is not millisecondaccurate • Limited validation with np “standards” • Little qualitative or “verbal” data • Can be used by Athletic Trainers, Team Physicians in absence of Neuropsych • May determine return to play decisions (Schatz & Zillmer, 2003, Applied Neuropsych) There’s a whole lot of post-concussion tests and schedules Comparison of Post-concussion Assessment Schedules and Measures. (From McKeever & Schatz, Applied Neuropsychology, 10, 2003) Study NCAA- Multiple sports (Echmendia, et al., 2001) NCAA-Football (Collins, et al., 1999) Schedule of Serial Post-Concussion Assessments Hours Days 1-2 24-48 3 5 7 10 30 2 24 7 30 1 3 5 24 5 Prof. Hockey Players (Echemendia, 2001) 24 5b Prof. Football Players (Lovell & Collins, 1998) 24 Prof. Rugby Players (Hinton-Bayre, et al., 1999) aAthletes dHVLT, hTrails, kDig. 7 Span, fSDMT, mCOWAT, nPegboard NCAA-Football (Barth, et al., 1989) Prof. Rugby Players (McCrory, et al., 1997) Measures Used cPC, dHVLT, fSDMT, gStroop, hTrails, jVIGIL/W, kDig. Span, lPSU,mCOWAT eSDMT, hTrails, oPASAT 10 7b cPC, dHVLT, fSDMT, iTrails, lPSU, mCOWAT, pBVMT-R dHVLT, fSDMT, hTrails, kDig. 5 Span, mCOWAT, nPegboard 1 eSDMT, rChoice 5 3a 7a 35 a eSDMT, qDigit RT., rMemory, rOrientation Symbol, rSpeed of Comprehension tested 1 to 3 days, 1-2weeks, 3-5 weeks post-concussion; bAthletes tested 5 to 7 days post-concussion Power In Numbers: Philadelphia Sports Concussion Program • • • • • Mandatory for Participation in Athletics Drexel, Temple, SJU… Delaware, Rutgers Baseline, 24-48 hr, 3, 5, 7, 10, weekly if Sx ImPACT @ 4 schools, CRI @ Temple Dissertations (McKeever, Covassin, Schneider), Master’s Theses – Validate multiple measures (ImPACT, CRI, CogSport, Trails, Digit Symbol, d2) – Gender, Sport, History, Club Sports, Cheerleaders, School Norms Cross-Validation of Computer-Based Measures - Rationale (Schatz & Putz, Applied Neuropsych 2006) • Limited “shared validation” of existing computer-based measures with standards • SDMT correlates with: – ImPACT Processing Speed (r=.70) and Reaction Time (r=.60) – CRI Processing Speed (r=.60, r=.67) • Trails correlates with: – – – – CRI Response Speed (A: r=.73; B: r=.74) CRI Processing Speed (B: r=.37) CogSport Complex RT (B: r=.34) CogSport Simple RT (B: r=.44) Cross-Validation of Computer-Based Measures - Methodology • 30 Normal Volunteers • Computer-based: ImPACT, CRI, CogSport, d2, Trails A&B, Digit Symbol • Paper-based: Trails A&B, Digit Symbol • Administration: MWF, Individually – Grouping A: ImPACT, d2 Test of Attention (computerized) – Grouping B: CRI, Trails A and B. and Digit Symbol (pencil and paper). – Grouping C: CogSport, Trails A and B, and Digit Symbol (computerized). – ABC, ACB, BAC BCA, CAB, CBA. Cross-Validation Example: ImPACT CRT Cross-Validation Example: CogSport CRT Cross-Validation Example: CRI CRT Cued Reaction Time: Press the spacebar as quickly as possible only when a white circle immediately follows the presentation of a black square. Cross-Validation of Computer-Based Measures - SRT Results IMPACT IMP ACT SRT --. HD_CRT COG_CRT .598* .001 .407* .026 .649** .001 .380** .038 .641** .001 .442* .014 DIGSYM -.455* .012 --- .404* .027 .391* .032 .292 .118 .428* .018 .232 .217 -.526** .003 --- .333 .072 .421* .021 .055 .772 .315 .091 -.303 .104 --- .420* .021 .544** .002 .535** .002 -.281 .132 .277 .138 .172 .362 -.076 .689 .613** .001 -.373* .042 HD_SRT HD_SRT . HD_CRT COG_CRT COG_SRT TRA TRB COG_SRT --- TRA --- TRB --- -.381* .038 Cross-Validation of Computer-Based Measures - CRT Results IMPACT IMP ACT SRT --. HD_CRT COG_CRT .598* .001 .407* .026 .649** .001 .380** .038 .641** .001 .442* .014 DIGSYM -.455* .012 --- .404* .027 .391* .032 .292 .118 .428* .018 .232 .217 -.526** .003 --- .333 .072 .421* .021 .055 .772 .315 .091 -.303 .104 --- .420* .021 .544** .002 .535** .002 -.281 .132 .277 .138 .172 .362 -.076 .689 .613** .001 -.373* .042 HD_SRT HD_SRT . HD_CRT COG_CRT COG_SRT TRA TRB COG_SRT --- TRA --- TRB --- -.381* .038 Cross-Validation of Computer-Based Measures - Processing Speed Results Digit Symbol Trails B -.381* Digit Symbol - ImPACT - p < . 05*, p < .004**, p < .001*** ImPACT HeadMinder -.506** .601*** .542** -.610*** - -.373* Cross-Validation of Computer-Based Measures - Memory Results ImPACT Visual ImPACT Verbal .340 CogSport Visual -.160 -.102 -.058 ImPACT Visual - -.012 CogSport Visual - - p < .05* CogSport Learning .723* Cross-Validation of Computer-Based Measures - Implications • These tests share some common variance on constructs such as processing speed and reaction time, but not within the domain of memory. • The Processing Speed Indices/measures (ImPACT, HeadMinder, Trails B and Digit Symbol) correlated the most consistently. • Baseline evaluations using one measure can not be used as a basis for post-concussion assessment using another measure. Cross-Validation of Computer-Based Measures - Limitations • Small sample size. • Reliance on univariate correlations. • Subjects assessed independently. • No concussed subjects. • Not comparing tests’ sensitivity to effects of concussion. Meanwhile… Concussion Effects on Youth Athletes? Relying on symptoms alone may be dangerous Attentional processes, memory, and cognitive speed are key elements of testing Younger athletes deserve particular attention Prolonged Effects of Concussion? (Schatz & McNamara ACN 2001 [Abstract]) • Self-reported history of concussion • 56 college freshmen, ages 17-19 • Divided into independent groups on the basis of concussion history: – 19 with one or more previous concussion, – 39 with self-reported history of no previous concussions. Prolonged Effects of Concussion? (Schatz & McNamara ACN 2001 [Abstract]) Mild, enduring effects of cerebral concussion can be identified in otherwise healthy college freshmen with a history of concussion.These enduring effects of previous cerebral concussions appear to involve attentional processes, and warrant further investigation. Prolonged Effects of Concussion? (Moser & Schatz ACN 2001; Moser, Schatz, Jordan, Neurosurgery 2005) • Youth Athletes from a college-prep boarding school (Ivy-bound) • Mandatory participation in sports • Multiple sports over 5-10 years • No concussion program in place • Attempt to understand/replicate Dependent Measure: RBANS Subtests measure multiple neurocognitive domains • Immediate Memory • Visuospatial/Contructional List Memory - recall of 10 words presented orally. Story Memory - recall of short story presented orally. Figure Copy - Copy of multi-part geometric drawing. Line Orientation - identify lines from a drawing. • Language Picture Naming - Naming of pictures of objects. Semantic Fluency - Name examples from category in one minute. • Attention Digit Span - Repeat a string of digits presented orally. Coding - Matches geometric shapes corresponding to numbers. • Delayed Memory List Recall - Recall 10 words learned in the List Learning subtest. List Recognition - recognition of 20 words presented orally. Story Memory - Recall of short story learned earlier. Figure Recall - Draw, from memory, the figure shown earlier. Prolonged Effects: Pilot Study (Moser & Schatz, Arch Clinical Neuropsych 2001) Youth athlete volunteers, divided into independent groups on the basis of concussion history. • Zero or One Previous Concussion: 8 healthy volunteers with either no history of concussion, or had sustained one previous concussion (not within the past six months). • Two+ Previous Concussions: 13 youth athletes who had sustained two or more previous concussions (not within the past six months). • Recent Concussion: 13 youth athletes who had sustained a recent concussion, with no identified medical or neuropsychological difficulties related to concussion one week after testing. Prolonged Effects: Pilot Results RBANS Mean Raw Scores Concussion Group n Total Coding Attention _____________________________________________________________ 0-1 Previous 8 Mean 252.63 63.88 77.38 Concussion SD 14.10 7.18 9.59 _____________________________________________________________ 2 or More Previous 13 Mean 240.54 55.92 68.69 Concussions SD 14.85 6.68 8.10 _____________________________________________________________ Rece nt 13 Mean 233.77 53.15 65.38 Concussion SD 15.92 10.71 9.20 _____________________________________________________________ RBANS Coding: [F(2,31)=3.98; p = .029; r = .50] RBANS Attn: [F(2,32)=4.59; p = .018; r = .55] Note: High er Mean Scores = Stronger Cognitive Functioning. Analyses are two-tailed; Effect sizes denoted by "r". Follow-up Study (Moser, Schatz & Jordan, Neurosurgery 2005) 238 youth athlete volunteers ... divided into four independent groups on the basis of concussion history. • No Concussion: 82 healthy volunteers with no history of concussion. • One Previous Concussion: 56 youth athletes who had sustained one previous concussion (not within the past six months). • Two+ Previous Concussions: 51 youth athletes who had sustained two or more previous concussions (not within the past six months). • Recent Concussion: 49 youth athletes who had sustained a recent concussion, with no identified medical or neuropsychological difficulties related to concussion within one week of testing. Prolonged Effects-GPA GPA by Concus s ion Gr oup 3.55 3.5 3.45 3.4 3.35 3.3 3.25 3.2 3.15 3.1 3.05 No Concussion: (82) One Previous: (56) Two+ Pr evious: ( 51) Concussion Group Recent: (49) Prolonged Effects-RBANS RBANS Subte st by Concus s ion Gr oup 80 No Concussion: (82) One Previous: (56) 70 Two+ Pr evious: ( 51) Recent: (49) 60 50 40 30 20 10 0 *Attn IMM DEM RBANS Subtest Lang VisC Prolonged Effects: Results • Multivariate Analysis of Variance (MANOVA) revealed a significant overall effect of concussion history on cognition [F(21,672)=1.8; p=.015]. • Univariate F-tests revealed significant main effects of concussion history on Attention [F(3,228)=4.72; p=.003] and GPA [F(3,228 =5.76; p=.001]. Prolonged Effects in Youth Athletes • Health non-concussed youth athletes with a history of concussion often show subtle deficits in attention and concentration at baseline assessment. • These enduring effects of previous cerebral concussions can be detected using traditional measures. • Concussions appear to occur in female athletes at a greater rate/frequency. Youth Athletes: What we think we know: Contributing to these findings: •A more vulnerable and susceptible youth brain •Participation in multiple sports over a long period of years. Emotionality • Feeling more emotional • Sadness • Nervousness • Irritability Somatic Symptoms Cognitive Symptoms • Attention Problems • Visual Problems • Dizziness • Balance Difficulties • Headaches • Light Sensitivity • Nausea • Memory dysfunction • “Fogginess” • Fatigue • Cognitive slowing Sleep Disturbance •Difficulty falling asleep • Sleeping less than usual Factor Analysis, Post-Concussion Symptom Scale N=327, High School,Univ Athletes Within 7 Days of Concussion (Pardini et al, 2004) Post-Concussion Gender Differences Covassin, Schatz, Swanik, Neurosurgery, 2007) 79 NCAA Division 1 Athletes • Completed ImPACT at baseline • Sustained concussion warranting serial assessment up to 10 days post-concussion • Average 3, 8 days post-concussion • Males (N=41): Baseball, cheerleading, football, ice hockey, lacrosse, soccer, volleyball, and wrestling • Females (N=38): basketball, cheerleading, gymnastics, lacrosse, soccer, softball, volleyball, Post-Concussion Gender Differences Covassin, Schatz, Swanik, Neurosurgery, 2007) Baseline: No Gender differences [F(5,73)=.80; P=0.55] Post-Concussion: 3x2 mixed-factoral design MANOVA • Time (Baseline, 3 days, 8 days): [F(2,76)=1670; P=0.0001; ES=.98] • Gender: [F(1, 77)=.16; p=.69; ES=.002] •Time x Gender Interaction: ]F(2,76)=.54; p=.59, ES=.01] Post-Concussion Gender Differences Covassin, Schatz, Swanik, Neurosurgery, 2007) Post-Concussion Symptoms: Male athletes reported significantly higher symptom scores for: • Sadness [F(1,77)=13.05, P=0.001] • Vomiting [F(1,77)= 5.95, P=0.017] Post-Concussion Gender Differences Covassin, Schatz, Swanik, Neurosurgery, 2007) Reliable Change Indices (RCI): At Time 1 (up to 3 days post-injury): • 58% of participants had one or more reliable declines in performance or increases in symptom reporting At Time 2 (up to 10 days post-injury): • 30% of participants were still showing one or more reliable changes from pre-season levels. NEW MANAGEMENT STRATEGIES CIS Group, Vienna (2001), Prague (2004) Removal of symptomatic athletes from play Graduated return to play Neuropsychological testing recommended “One of the Cornerstones of Management” Aubry, Cantu, Dvorak, Graf-Baumann, Johnston, Kelly, Lovell, McCrory, Meeuwise, Schasmasch, 2001. Clinical J. Sports Med. Current Large-Scale Programs Neuropsychological Testing 20 NFL Teams IRL, F1, CHAMP Car NASCAR USA Olympic Hockey USA Hockey 400 + High Schools in US 60 Sports Medicine Clinics in US Pro Boxing in California USA Ski Team USA Soccer Juniors Ontario Hockey League New Zealand Rugby S. African Rugby World Cup Soccer 150 + Universities in US Many Neuropsychology Clinics in US Major League Baseball Major League Baseball Umpires WHY USE NEUROPSYCHOLOGICAL TESTING? Unique Contribution To The Diagnostic Puzzle Testing Provides Unique Information Concussed Athletes Often Deny Symptoms Athletes May Lack Awareness of Symptoms UNIQUE CONTRIBUTION OF NEUROPSYCHOLOGICAL TESTING TO CONCUSSION MANAGEMENT Symptomatic Testing reveals cognitive deficits in asymptomatic athletes within 4 days post-injury Asymptomatic 100 95 90 85 80 75 70 65 60 55 50 Ve rbal Memory N=215, MANOVA p<.000000 Visual Memory Control UNIQUE CONTRIBUTION OF NEUROPSYCHOLOGICAL TESTING TO CONCUSSION MANAGEMENT Symptomatic Asymptomatic Control Symptomatic 0.8 50 0.7 45 0.6 Aysmptomatic Control 40 0.5 35 0.4 0.3 30 0.2 25 Reaction Time Reaction Time Processing Speed Processing Speed MANOVA p<.000000 (ImPACT Test Battery) VALUE ADDED OF NEUROPSYCHOLOGICAL TESTING NP testing increases Diagnostic yield to 88% 100 95 90 85 80 75 70 65 60 55 50 %declined From baseline 88 82 EITHER Either 65 NEUROPSYCH Neuropsych Symptoms SYMPTOMS % DEC LINED FRO M BL 201 concussed High School and collegiate athletes tested with 2 days of injury. Abnormal performance determined by RCI’s (van Kampen, 2004). WHY USE NEUROPSYCHOLOGICAL TESTING? Mild or “Ding” Injuries May be Significant Cannot gauge severity of injury based on initial symptoms Acute recovery may not be a linear process Concussion and Memory Dysfunction 64 high school athletes with Grade 1 concussion 24 Non-injured control subjects All athletes diagnosed with ”ding” Confusion, amnesia, signs/symptoms cleared within 15 minutes No athlete in sample sustained LOC No athlete returned to contest ImPACT evaluation obtained at baseline, 36 hours, 4 days and 7 days post-concussion Lovell et al., J. Neurosurgery, 2003. Memory Impairment Following “Mild Concussion” CONCUSSED CONTROLS 90 85 80 75 70 Baseline 36 Hours Day 4 Time of Evaluation Lovell, Collins, Iverson et al., J. Neurosurgery, 98, 2003 Day 7 Summary Current research supports the use of neuropsychological testing following concussion Relying on symptoms alone may be dangerous Attentional processes, memory, and cognitive speed are key elements of testing Younger athletes deserve particular attention And Now for Something Completely Different… Effort: (Green, et al., Brain Injury, 2001) • >50% of variance in scores was due to poor effort • Education = 11% • Age = 4% Symptom Validity Testing (Bush, et al NAN, ACN),: “it is necessary to evaluate symptom validity objectively in any neuropsychological assessment” And Now for Something Completely Different… • Daubert v. Merrell Dow Pharmaceuticals (1993) held that trial judges should permit expert scientific testimony only when “the reasoning or methodology underlying the testimony is scientifically valid, and …properly can be applied to the facts in issue.” And Now for Something Completely Different… Effort Tests: • Rey 15-item, Dot Counting • Test of Memory Malingering (TOMM) • Word Memory Test (WMT) • CARB (Comp. Assess. Response Bias) • Validity Indicator Profile (VIP) • MMPI-2 Assessment of Effort - Rationale (Schatz & Sucharski, in some stage of submission) • Little data on effort at time of assessment: – “…speculation that athletes are often motivated to underreport symptoms so they can return to competition” (Echemendia & Cantu, 2003) – “…motivated to underreport subjective symptoms to hasten the return to competition.” (Erlanger, et al., 2003) – “An athlete’s apparent fear of removal from a game or of losing his or her position on the team may tempt some athletes to deny or underreport postconcussive symptoms.” (Lovell, 1998) – “Ostensibly, symptom minimization occurs in hopes of a faster return to the playing field, court or ice.” (Lovell, et al., 2002) – “it is more likely that suspicion regarding the use of the test results and/or general disinterest and apathy could impact the accurate measurement of cognitive ability at baseline” (Echemendia & Cantu, 2003) Assessment of Effort - Rationale • Bailey, Echemendia, Arnett (2006), JINS – Assigned to High Motivation at Baseline (HMB) and Suspect Motivation at Baseline (SMB) groups based on whether baseline performance fell one or more standard deviations from the mean of the given measure – N=26 to 33, Pre, Post-Mild TBI, Trails, Dig Span, Stroop – In repeated measures ANCOVA (that removed achievement performance), the SMB groups demonstrated greater improvement than the HMB groups for the Trail Making Test A & B ( TMT-A & B), Digit Span, and Stroop-Color Word (Stroop-CW) tests. Assessment of Effort - Methodology • 155 Participants: 77 athletes, 78 from human subjects pool • Administered Word Memory Test (WMT) and ImPACT • Only looked at Baseline performance Assessment of Effort - Methodology Word Memory Test (WMT): 1. Show word pairs (e.g., Boy-Girl) 2. Show “cue” word (e.g., Boy) 3. Show “target” choices (e.g., Girl, Truck) TBI Patients 95%+ Assessment of Effort - Incidence • Incidence of Poor Effort Good (>95%) Poor (<95%) Athletes 48 (62.3%) 29 (37.7%) Non-athletes 43 (55.1%) 35 (44.9%) [X^2(1, N=155) =.831; p=.36] Assessment of Effort - Effects Good (>95%) P oor (<95%) F Sig. F SYMP T OM T OT A L 6.97 (9.642) 10.73 (13.394) 4.148 .043 VERBAL MEMORY .892 (.081) .831 (.110) 15.689 .000 VISUAL MEMORY .767 (.127) .701 (.126) 10.327 .002 P ROCESS SPEED 42.676 (5.871) 38.128 (7.834) 17.063 .000 REACT IONTIME .537 (.077) .562 (.075) 4.120 .044 IMP ULSE CT RL 8.912 (14.238) 10.922 (17.151) .631 .428 Validation of MilliSecond Accuracy in MicroComputers (unpublished data) PhotoCell Internal Timer External Timer Mouse-click=stops both Compare… Calculate Difference Score Validation of MilliSecond Accuracy in MicroComputers (unpublished data) Validation of MilliSecond Accuracy in MicroComputers Validation of MilliSecond Accuracy in MicroComputers Validation of MilliSecond Accuracy in MicroComputers Validation of MilliSecond Accuracy in MicroComputers Millisecond Accuracy? Baseline to post-concussion computers Caution when interpreting reaction time and processing speed Use of software by clinicians Assessment of Effort - Implications • Given the wide-spread use of computer-based tests for the purpose of documenting baseline cognitive function in athletes, neuropsychologists and sports-medicine professionals should utilize external measures of athletes' effort. • Further, employing normal controls from human subjects pools may provide less accurate comparisons than desired. What we need to know more about: Diagnosing and managing concussions with computer-based measures: • Ongoing, external validation of existing measures • Ongoing validation of computer-based measures in prospective clinical samples • Accurate standard for timing accuracy What we need to know more about: Diagnosing and managing concussions in youth athletes: • Junior High, Grade School, Youth Leagues • JV, Club Sports • Gender What we NEED: • Baseline screenings for all athletes, but especially in vulnerable youth athletes. -documenting pre-concussion status, -pre and post concussion comparisons -multiple “sliding” baseline. • Public service announcements • Involvement /awareness of pediatricians and family practices = Neurop$ychology
