View
Looking for signals in tens of thousands of GeneChips
Dr Andrew Harrison
Departments of Mathematical
Sciences and Biological
Sciences
University of Essex harry@essex.ac.uk
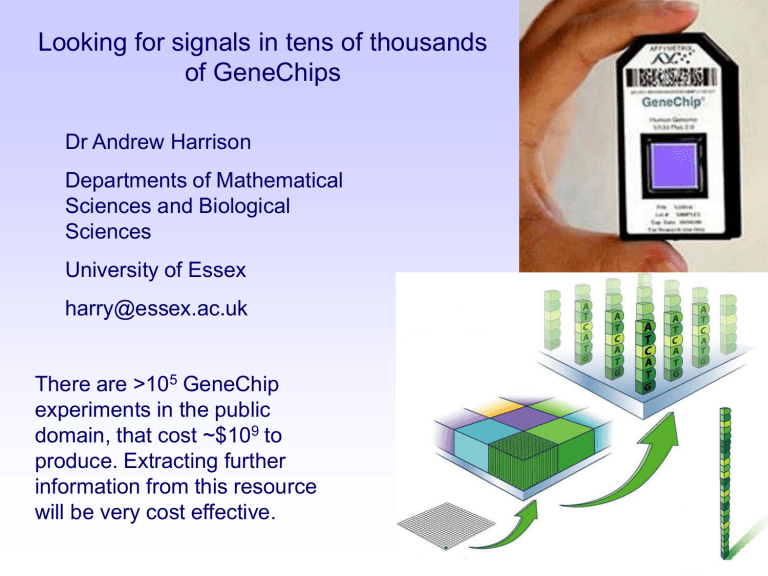
There are >10 5 GeneChip experiments in the public domain, that cost ~$10 9 to produce. Extracting further information from this resource will be very cost effective.
Microarray informatics at Essex University
Departments of Mathematical Sciences and Biological Sciences
Faculty
Dr Andrew Harrison
Professor Graham Upton
Dr Berthold Lausen
Degrees in …..
Physics
Statistics
Statistics
+ Dr Hugh Shanahan (Royal Holloway) Physics
PhD students
Farhat Memon
Anne Owen
Fajriyah Rohmatul
Computer Science
Mathematics
Statistics
Current MSc and UG students
Aleksandra Iljina
Lina Hamadeh
Madalina Ghita
Alumni
Dr Jose Arteaga-Salas
Dr Renata Camargo
Dr Caroline Johnston
Dr William Langdon
Dr Joanna Rowsell
Dr Olivia Sanchez-Graillet
Dr Maria Stalteri
+ 4 former MSc students
Statistics and Data Analysis
Statistics and Data Analysis
Mathematics
Statistics
Computer Science
Molecular Biology and Bioinformatics
Computer Science and Physics
Mathematics
Computer Science and Bioinformatics
Inorganic Chemistry and Bioinformatics
Perfect Match (PM)
Mismatch (MM)
The biggest uncertainty in
GeneChip analysis is how to merge all the probe information for one gene -
Harrison, Johnston and
Orengo, 2007, BMC
Bioinformatics, 8: 195 m=log
2
(Fold Change), a=log
2
(Average Intensity)
There is a huge multiple-testing problem.
What can be learnt from comparing different experiments?
Some genes are represented by multiple probe-sets.
Probe-set A Probe-set B
If they are measuring the same thing the signals should be up and down regulated together.
Is that always true?
No
Stalteri and Harrison, 2007,
BMC Bioinformatics, 8:13
Probes map to different exons. Alternative splicing may cause some exons to be upregulated and others to be downregulated.
Genes come in pieces.
But exons do not. Multiple probes mapping to the same exon should measure the same thing.
We are studying the correlations in expression across >6,000 GeneChips
(HGU-133A), sampling RNA from many tissues and phenotypes.
The correlations in intensities
(log2) between probes in probeset
208772_at on the HG-U133A array.
The number in each square is the correlation ×10
Blue = low correlation
Yellow = high correlation
Average intensity in GEO
Probe order along the gene
The correlation calculated for PM probes 9 and 11 , the data in the earlier scatter plot, is reported as 8 (0.76 multiplied by 10 and rounded).
This probeset shows no coherent correlations amongst its probes.
Some probesets clearly have outliers.
Probes 1-11 all map to the same exon.
This is a different probeset mapping to the same exon – there seems to be one outlier.
The outliers are correlated with each other!
There is little sequence similarity between the probes, they are from probe-sets picking up different biology, yet they are correlated!
TCCTGGACTGAGAAAGGGGGTTCCT
GAGACACACTGTACGTGGGGACCAC
GGTAGACTGGGGGTCATTTGCTTCC
Virtually all of the probes in the group have runs of Guanines within their 25 bases.
Comparing probes with runs of Gs.
Number of contiguous Gs
3
4
5
6
7
Mean
Correlation
0.14
0.42
0.49
0.62
0.75
We are only looking at a small fraction of the entire probe, yet it is dominating the effects across all experiments.
G-quadruplexes
G
G
G
G
G
G
G
G
G
G
G
G
Probes all have the same sequence in a cell – a run of guanines will result in closely packed DNA with just the right properties to form G-quadruplexes.
Upton et al. 2008 BMC Genomics, 9, 613
How do we deal with known outliers such as G-quadruplexes?
What is the best way to calculate expression in the presence of outliers?
G-stacks bias which genes are reported to be clustered together within published experiments.
Kerkhoven et al. 2008, PLoS ONE 3(4): e1980
Probes containing GCCTCCC will hybridize to the primer spacer sequence that is attached to all aRNA prior to hybridization.
Log(magnitude) of averaged probe values
Colour coded by size. Note the perimeter of bright-dark pairs.
Cell (0,0) contains a probe which does not measure any biology
Corner correlations
(correlations with values in cell (0,0))
Numbers are correlations times 10 (red greater than 0.8)
Negative correlations appear as blanks
Filled circles indicate probes not listed in CDF file.
Large circles indicate correlations greater than 0.8
Correlations with cell (0,0)
Being in the opposite corner has not reduced the correlations of the interior row and column
What are in the sheep pens?
Entries are correlation with cell (0,0)
Entries are log(mean(Intensity))
Sheep!
Many thousands of probes are correlated with each other simply because they are adjacent to bright probes.
We believe that the focus of the scanner may be responsible – regions adjacent to bright spots will gain the same fraction of light.
A comparison of many images at different levels of blurriness will appear to indicate that dark regions adjacent to bright regions are correlated in their intensities.
A CEL file contains information about the ID of the scanner as well as the date on which the image was scanned – how does the impact of blur change over time for each scanner?
Upton and Harrison, 2010,
Stat Appl Genet Mol Biol, 9(1),
Article 37
How best to transform a DAT image into a CEL file?
We are testing whether ideas from astronomy are applicable.
We are checking whether the temporal patterns in scanner performance for human and other organisms are related.
Bioinformatix, Genomix, Mathematix, Physix, Statistix, Transcriptomix are needed in order to extract reliable information from
Affymetrix GeneChips


