September 2014 Month End Comments
advertisement

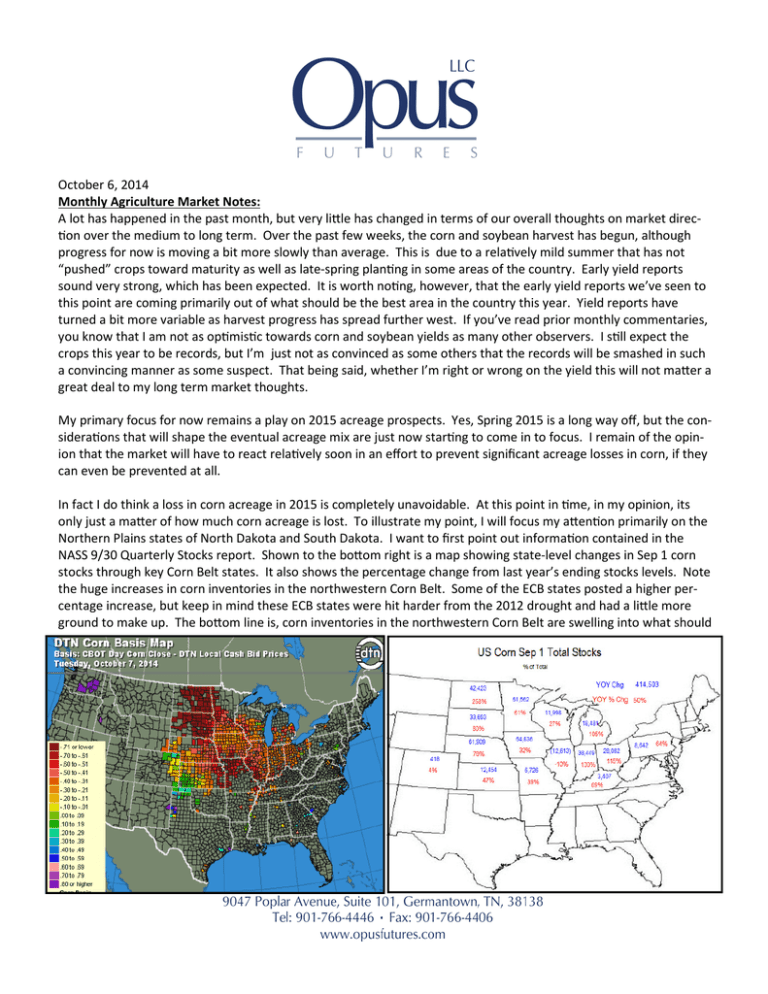
October 6, 2014 Monthly Agriculture Market Notes: A lot has happened in the past month, but very lile has changed in terms of our overall thoughts on market direc!on over the medium to long term. Over the past few weeks, the corn and soybean harvest has begun, although progress for now is moving a bit more slowly than average. This is due to a rela!vely mild summer that has not “pushed” crops toward maturity as well as late-spring plan!ng in some areas of the country. Early yield reports sound very strong, which has been expected. It is worth no!ng, however, that the early yield reports we’ve seen to this point are coming primarily out of what should be the best area in the country this year. Yield reports have turned a bit more variable as harvest progress has spread further west. If you’ve read prior monthly commentaries, you know that I am not as op!mis!c towards corn and soybean yields as many other observers. I s!ll expect the crops this year to be records, but I’m just not as convinced as some others that the records will be smashed in such a convincing manner as some suspect. That being said, whether I’m right or wrong on the yield this will not maer a great deal to my long term market thoughts. My primary focus for now remains a play on 2015 acreage prospects. Yes, Spring 2015 is a long way off, but the considera!ons that will shape the eventual acreage mix are just now star!ng to come in to focus. I remain of the opinion that the market will have to react rela!vely soon in an effort to prevent significant acreage losses in corn, if they can even be prevented at all. In fact I do think a loss in corn acreage in 2015 is completely unavoidable. At this point in !me, in my opinion, its only just a maer of how much corn acreage is lost. To illustrate my point, I will focus my aen!on primarily on the Northern Plains states of North Dakota and South Dakota. I want to first point out informa!on contained in the NASS 9/30 Quarterly Stocks report. Shown to the boom right is a map showing state-level changes in Sep 1 corn stocks through key Corn Belt states. It also shows the percentage change from last year’s ending stocks levels. Note the huge increases in corn inventories in the northwestern Corn Belt. Some of the ECB states posted a higher percentage increase, but keep in mind these ECB states were hit harder from the 2012 drought and had a lile more ground to make up. The boom line is, corn inventories in the northwestern Corn Belt are swelling into what should be a record harvest. It is no wonder that basis levels in the northwestern Corn Belt are among the worst in the country. A recent map showing the na!onal basis levels is also aached on the boom of the previous page. Another way of looking at this significant increase in corn supplies in the northwestern Corn Belt is shown below. The following table takes a “what-if” look at ending stocks by state with some assump!ons on the 14/15 season. The first assump!on is to take the NASS Sept produc!on es!mate for each state, though many would argue these es!mates are too low. The second assump!on is to assume equal demand in each state for 14/15 as what was seen in the 13/14 season. This assump!on makes sense considering WASDE, and a lot of private analysts, are assuming total US corn demand to be rela!vely flat YOY. The point here is to illustrate that corn inventories in ND and SD, along with a few other western Corn Belt states, are expected to con!nue to swell under current baseline produc!on and demand assump!ons. This would mean that there would be no relief to the current basis pressure the region is seeing, and in fact it would likely get worse. Obviously this raises interes!ng ques!ons about what to think about next year. The USDA’s ERS has some prey useful informa!on on cost of produc!on by region that is helpful for these purposes. Note the map here showing the ERS’s regional breakdown. Going forward I’ll be looking at the “Northern Great Plains” region as shown on the map. I understand that a key por!on of South Dakota’s produc!on is not included in this region (the southeastern corner of the state), but I’m merely trying to illustrate the overall situa!on for the en!re area here. Shown below is a breakdown of the ERS’s es!mates on cost of produc!on and returns per planted acre (excluding government payments) for this region. Their data obviously ends with 2013, but you’ll see I have added a column (highlighted in orange) for 2014. I have kept all of the cost of produc!on es!mates unchanged and have highlighted my assump!ons on yield and price in yellow near the boom. Obviously there will be some hedges and forward contracts in place that will mean not all bushels will receive this price level, but again, keep in mind this is for illustra!ve purposes to show what the current state of affairs in this region is today with current prices. The key value to look at is the calcula!on for “value of produc!on less opera!ng costs”. The implica!on shown here is we are geCng towards levels, at current prices, where the farmer cannot cover his cost of produc!on. With inventories in this region expected to build further in the 14/15 marke!ng year, as shown above, the prices farmers in this region are going to get aren’t likely to get much beer. This clearly doesn’t bode well for corn area in this region for 2015. In fact we already saw a slight decline in corn area in this region in 2014 with the math on corn looking a bit less friendly. Now the math on corn looks downright nega!ve. For comparison, on the following page, I have also performed the same sort of look on cost of produc!on on soybeans for this region. The same format applies. I kept produc!on costs unchanged and used my own es!mates for yield and price. The key thing to note on this chart is that soybeans remain well above opera!ng costs. Clearly the simple math shown here would seem to imply that soybeans will be greatly favored in this area for 2015. In addi!on to compe!!on from soybeans, corn will also compete with small grains (such as oats, barley, etc) for acreage in this region. This region of the country, which appears burdened with surplus corn supplies, will be interes!ng to keep an eye on. When the market starts to consider 2015 acreage projec!ons, it’ll be interes!ng to see where the early guesses are drawn. Another way of looking at the rela!ve “worth” of corn area vs. soybeans is shown in the chart below. I included this chart in last month’s update, but the data is current through the !me of wri!ng. The chart es!mates net revenue of corn vs. soybeans with certain assump!ons on yield, basis, and cost of produc!on. The rela!ve “value” of corn has bounced a lile vs. soybeans over the past few sessions, but to even consider that corn has a chance of maintaining this year’s current acreage, you’d probably want to see that figure near the even level. That is a long way to go. The discussion above shows that key produc!on states of ND/SD are likely to lose major corn area in 2015 as burdensome local supplies weigh on basis and push corn’s gross revenue near or below cost of produc!on. The chart to the right indicates that corn acres might be tough to jus!fy on a na!onal level as well. So the obvious ques!on is, why does it maer? What difference does it make if we lose corn area in 2015 if one of the main reasons why we lose this area is due to over-supply in the first place? The hopeful answers to that ques!on are shown on the balance sheet on the following page. The balance sheet below shows how the 15/16 balance sheet might look with a significant loss in acreage next year. That being said, one thing you’ll probably instantly no!ce is my produc!on es!mate for 14/15 is lower than consensus. I s!ll suspect the market has become a bit carried away with produc!on expecta!ons for this year’s crop. Again, I base that on my own observa!ons from my annual crop trip and various yield models that have served me well over the years. Might this year’s “outlier” crop make those models and the crop trip analysis different this year? Yes, that is a possibility and certainly one I’ve considered extensively. One last thing to consider for the corn balance sheet above. It isn’t just the US that is looking at corn prices and costs of produc!on. Corn area around the world is likely to shrink and inputs into corn produc!on are likely to be scaled back. Beyond the harvest of this year’s record US crop, 2015 corn produc!on is likely to be in retreat around the world. This could put further pressure on US supplies in terms of export demand, perhaps more than what is shown above. At this point it probably sounds like I am bullish corn, but the truth is, I’m really not. I just believe further downside to corn prices from current levels is fairly limited. On the other hand, I suspect there remains significant downside in soybean prices. I have aached current balance sheet thoughts for soybeans on the following page. My produc!on es!mate for this year’s soybean crop, as in the case of corn, is below consensus...but not as drama!cally. You can see the prospects for higher soybean area in the US next year and what that does to the soybean balance sheet and carryout. The obvious implica!on here is that either corn prices “should” work harder to secure addi!onal acres in 2015 or soybeans should work to lessen the expected increase in acreage in 2015. As noted above, I’m not convinced there is much corn prices can do to prevent a decline in acreage in the Northern Plains. That area’s infrastructure/logis!cs is just not equipped to handle the current corn supply. With that in mind, I think it is a foregone conclusion that soybean area will gain in 2015 at the expense of corn. Right now it is only a maer of how much. I will maintain my posi!on in long December 2015 corn contracts while short November 2015 soybean contracts. I think we are in the very early stages of the market’s acceptance of this reality. RespecFully, David Zelinski Opus Futures, LLC Disclaimer: The informaon contained herein has been taken from trade and stascal services and other sources we believe are reliable. Opinions expressed reflect judgments at this date and are subject to change without noce. Opus Futures, LLC does not guarantee that such informaon is accurate or complete and it should not be relied upon as such. There is risk of loss in trading futures and opons and it is not suitable for all investors. PAST RESULTS ARE NOT NECESSARILY INDICATIVE OF FUTURE RETURNS. This document contains only commentary on economic, polical, or market condions and is not intended to be the basis for a decision to enter into any derivaves transacon. The contents of this commentary are for informaonal purposes only and under no circumstances should they be construed as an offer to sell or a solicitaon to buy or sell any futures or opons contract. This material cannot be copied, reproduced, modified, or redistributed without the wri2en consent of Opus Futures, LLC. No one has been authorized to distribute this for sale.


