T8 Final Presentation
advertisement
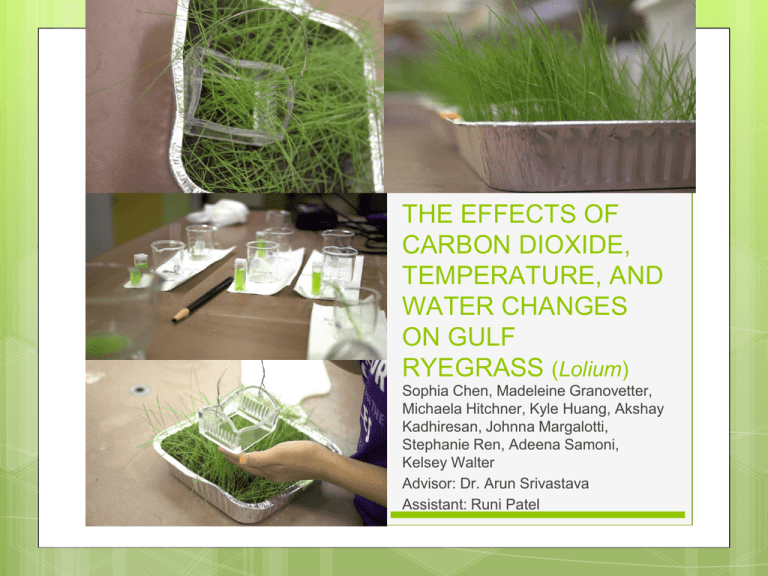
THE EFFECTS OF CARBON DIOXIDE, TEMPERATURE, AND WATER CHANGES ON GULF RYEGRASS (Lolium) Sophia Chen, Madeleine Granovetter, Michaela Hitchner, Kyle Huang, Akshay Kadhiresan, Johnna Margalotti, Stephanie Ren, Adeena Samoni, Kelsey Walter Advisor: Dr. Arun Srivastava Assistant: Runi Patel What is Global Climate Change? ○ Greenhouse effect Effects of Global Climate Change ○ Elevated temperatures Impact of Climate Change on the Biosphere The Investigation ○ How will global climate change affect the growth of future plants? ○ Observed species: ○ ○ ○ Ryegrass (Lolium) Algae Simulated conditions: ○ ○ ○ Increased levels of CO2 Elevated temperature Varied precipitation Hypotheses ○ Increased levels of CO2 ○ ○ Elevated temperature ○ ○ More CO2 will lead to more plant/algal growth and productivity Plant/algal growth and productivity will be negatively affected at higher temperatures Varied precipitation ○ Flood and drought conditions will hinder plant/algal growth and productivity Growth Density of Grass Samples Exposed to Varying Amounts of CO2 At higher CO2 levels, density of growth decreased. Average Height of Grass Samples Exposed to Varying Amounts of CO2 When exposed to the greatest amount of CO2, grass showed the most significant growth. Carbon Dioxide Manipulation Effects on Biomass Samples exposed to elevated levels of CO2 showed an increase in biomass Spectrophotometry Readings to Measure Chloroplast Count Absorbance spectrums for chloroplasts in CO2 variant trays with (A) initial values and (B) final values Key: 400 ppm = Red; 550 ppm = Yellow; 850 ppm = Blue As CO2 increased to 850 ppm, there were higher absorbance readings, indicating fewer chloroplasts. Color and Plasmolysis Comparison for CO2 Over time the plant’s color lightened and plasmolysis occurred when CO2 was increased. Fluctuations in pH Due to CO2 Manipulation pH remained relatively stable under conditions of elevated CO2 Effects of CO2 on Algal Growth Increased CO2 leads to an increase in algal growth. The higher the temperature, the less the growth rate of the grass. Absorbance spectrums for chloroplasts in temperature-variant trays with (A) initial values and (B) final values; 31.6°C = Red; 29.6°C = Yellow; 32.0°C = Blue As the temperature decreased, there were fewer chloroplasts. Discussion (Temperature) Greatest Growth 29.6 degrees Supports hypothesis Poorest Growth 32 degrees Supports hypothesis Most Chloroplasts 32 degrees Contradicts hypothesis Fewest Chloroplasts 29.6 degrees Contradicts hypothesis Control (31.6 degrees) Increased growth, but not as much as the lowest temperature Supports hypothesis Effects of Variable Water Effects of Variable Water Discussion (Water) Greatest Growth 180 mL/day Contradicts hypothesis Poorest Growth 120 mL/day Supports hypothesis Most Chloroplasts Control of 120 mL/day (sharp increase over 6 days) Contradicts hypothesis Fewest Chloroplasts 180 mL/day Contradicts hypothesis Control (150 mL/day) Constant growth Supports hypothesis Real Life Application ○ ○ ○ ○ Agriculture industry Change in ecosystems Adapt to new living conditions Global climate change will persist into the future and continue to be a growing issue Acknowledgments ○ Dr. Srivastava for his constant support, attention, and guidance ○ Dr. Cassano and Professor Scarano for always unlocking the greenhouse and being there for us in times of need ○ Dr. Surace for continually checking in on us ○ Runi for her all time leadership, dedication, care, undying love, and delicious grass cake Acknowledgments continued ○The grass for being obedient and reciprocating our love and passion ○NJGSS sponsors for providing us with this wonderful and invaluable experience ○ Independent College Fund of NJ/Johnson & Johnson ○ AT&T ○ Actavis Pharmaceuticals ○ Celgene ○ Novartis ○ Bayer Healthcare ○ Laura (NJGSS ’86) and John Overdeck ○ NJGSS Alumnae and Parents of Alumnae ○ Board of Overseers, New Jersey Governor’s Schools ○ State of New Jersey ○ Drew University References Mitchell JFB. The “Greenhouse” Effect and Climate Change. Reviews of Geophysics. 1989;[Internet]. [cited 2014 July 29] 27(1) : 115. Available from: http://www.webpages.uidaho.edu/envs501/downloads/Mitchell%201989.pdf. Intergovernmental Panel on Climate Change [Internet]. [updated 2007 Feb 5]. Climate Change 2007: The Physical Science Basis; [cited 2014 July 29]. Available from: http://www.slvwd.com/agendas/Full/2007/06-07-07/Item%2010b.pdf. Falkowski P, Scholes RJ, Boyle E, Canadell J, Canfield D, Elser J, Gruber N, Hibbard K, Högberg P, Linder S, and others. The Global Carbon Cycle: A Test of Our Knowledge of Earth as a System. Science. 2000;[Internet]. [cited 2014 July 29] 290(5490) : 291-296. Available from: http://www.sciencemag.org/content/290/5490/291.full. Solomon S, Plattner G, Knutti R, Friedlingstein P. Irreversible climate change due to carbon dioxide emissions. PNAS. 2008; [Internet]. [cited 2014 July 29] 106(6) : 1704-1709. Available from: http://www.pnas.org/content/106/6/1704.long. Solomon S, Plattner G, Knutti R, Friedlingstein P. Irreversible climate change due to carbon dioxide emissions. PNAS. 2008; [Internet]. [cited 2014 July 29] 106(6) : 1704-1709. Available from: http://www.pnas.org/content/106/6/1704.long. Rowan R. Coral bleaching: Thermal adaptation in reef coral symbionts. Nature. 2004; [Internet]. [cited 2014 July 30] 430 : 742. Available from: http://www.nature.com/nature/journal/v430/n7001/pdf/430742a.pdf. Hughes TP, Baird AH, Bellwood DR, Card M, Connolly SR, Folke C, Grosberg R, Hoegh-Guldberg O, Jackson JBC, Kleypas J, and others. Climate Change, Human Impacts, and the Resilience of Coral Reefs. Science. 2003; [Internet]. [cited 2014 July 30] 301(5635) : 929-933. Available from: http://www.sciencemag.org/content/301/5635/929.full National Geographic [Internet]. Effects of Global Warming; [cited 2014 July 30]. Available from: http://environment.nationalgeographic.com/environment/global-warming/gw-effects/. Tans P, Keeling R. Recent Monthly Average Mauna Loa CO2. ESRL Global Monitoring Division. [Internet]. [cited 2014 July 30]. Available from: http://www.esrl.noaa.gov/gmd/ccgg/trends/ Cox PM, Betts RA, Jones CD, Spall SA, Totterdell IJ. Acceleration of global warming due to carbon cycle feedbacks in a coupled climate model. Nature. 2000; [Internet]. [cited 2014 July 30] 408 : 184-187. Available from: http://www.nature.com/nature/journal/v408/n6809/full/408184a0.html. Cox PM, Betts RA, Jones CD, Spall SA, Totterdell IJ. Acceleration of global warming due to carbon cycle feedbacks in a coupled climate model. Nature. 2000; [Internet]. [cited 2014 July 30] 408 : 184-187. Available from: http://www.nature.com/nature/journal/v408/n6809/full/408184a0.html. Projections of Future Changes in Climate [Internet]. Intergovernmental Panel on Climate Change (IPCC); [cited 2014 Jul 29]. Available from: http://www.ipcc.ch/publications_and_data/ar4/wg1/en/spmsspm-projections-of.html Projections of Future Changes in Climate [Internet]. Intergovernmental Panel on Climate Change (IPCC); [cited 2014 Jul 29]. Available from: http://www.ipcc.ch/publications_and_data/ar4/wg1/en/spmsspm-projections-of.html Stewart E. How much rain is an inch of rain?. WVEC Television, Inc., A Gannett Company. 2010 Mar 10; [Internet]. [cited 2014 Jul 29]. Available from: http://www.wvec.com/weather/knowledge/How-much-rain-is-an-inch-of-rain-87270487.html The ultimate climate change FAQ [Internet]. Guardian News and Media Limited or its affiliated companies; [cited 2014 Jul 29]. Available from: http://www.theguardian.com/environment/series/the-ultimate-climate-change-faq Riebesell U, Zondervan I, Rost B, Tortell PD, Zeebe RE, Morel FMM. Reduced calcification of marine plankton in response to increased atmospheric CO2. Nature. 2000 Sept 21; [Internet]. [cited 2014 Jul 29] 407: 364-367. Available from: http://www.nature.com.ezproxy.drew.edu/nature/journal/v407/n6802/full/407364a0.html Dissolved Oxygen [Internet]. Department of Wildlife & Fisheries Sciences Texas A&M AgriLife Extension Service; [cited 2014 Jul 29]. Available from: http://aquaplant.tamu.edu/faq/dissolvedoxygen/ Hannaway DB, Larson C, Myers D, Cool M. Annual Ryegrass (Lolium multiflorum Lam.) [Internet]. [updated 2004 Aug 13]. [cited 2014 Jul 29]. Available from: http://forages.oregonstate.edu/php/fact_sheet_print_grass.php?SpecID=2&use=Forage Taub DR. Effects of Rising Atmospheric Concentrations of Carbon Dioxide on Plants. Nature Education Knowledge. [Internet]. [cited 2014 Jul 29] 3(10):21. Available from: http://www.nature.com/scitable/knowledge/library/effects-of-rising-atmospheric-concentrations-of-carbon-13254108 Sullivan JT, Sprague VG. The Effect of Temperature on the Growth and Composition of the Stubble and Roots of Perennial Ryegrass. Plant Physiology. Oct 1949; [Internet]. [cited 2014 Jul 29] 24(4): 706-719. Available from: http://www.ncbi.nlm.nih.gov/pmc/articles/PMC437418/?page=12 Smillie RM, Critchley C, Bain JM, Nott R. Effect of Growth Temperature on Chloroplast Structure and Activity in Barley. Plant Physiology. 1978; [Internet]. [cited 2014 Jul 29] 62:191-196. Available from: http://www.plantphysiol.org/content/62/2/191.full.pdf+html Temperature, Precipitation, and Drought [Internet]. National Climatic Data Center, National Oceanic and Atmospheric Administration (NOAA); [cited 2014 Jul 29]. Available from: http://www.ncdc.noaa.gov/temp-and-precip/. References (Images) http://sites.duke.edu/biology217_01_s2011_mkg14/files/2011/04/rtr1kqt c.jpg http://blog.fitnesstown.ca/wp-content/uploads/2010/02/greenhousegases.jpg http://www.samefacts.com/wpcontent/uploads/2014/05/glacier152fbe8bff3a5f.jpg http://www.weather.gov/images/nws/features/532019.JPG http://www.nab.vu/sites/all/files/coral-bleaching-1.jpg https://encrypted-tbn3.gstatic.com/images?q=tbn:ANd9GcSVTV0tAwgYMpSWs7ULwvF2uCPf2rJwXYS6WWb43DNNc4OITQQ http://images.huffingtonpost.com/2014-01-08DroughtSunEarthDrReeseHalter.jpg https://encrypted-tbn1.gstatic.com/images?q=tbn:ANd9GcS5gCa3-mSY-SbOJWu9y36ui65uRvvTPnxdn_ausFVReq_PJOgFYxdbVtg http://www.climate-change-guide.com/images/polar-bear-trapped.jpg And KYLE HUANG NJGSS ‘14 Statistical Analysis: Grass Height Control (400 ppm) versus increased CO2 (550 ppm) H0: μ1 = μ2 Hα: μ1 > μ2 Given that μ1 is the true mean growth height for the grass treated with 550 ppm and μ2 is the true mean growth height for the grass treated with 400 ppm, assume that the sample is random, independent, and normal, then run a two-sample T test. t = -0.6634 | p = 0.7378 | df = 8.5905 x̄1 = 11.505 | x̄2 = 11.920 | Sx1 = 1.2843 | Sx2 = 0.8357 α = 0.05 The p-value, 0.7378, is far greater than the significance level of 0.05. We thus have insufficient evidence to reject the null hypothesis, and maintain that the true average height of grass treated with 550 ppm of CO2 is not significantly greater than that of grass treated with 400 ppm of CO2.
