ER Diagram Elements
advertisement
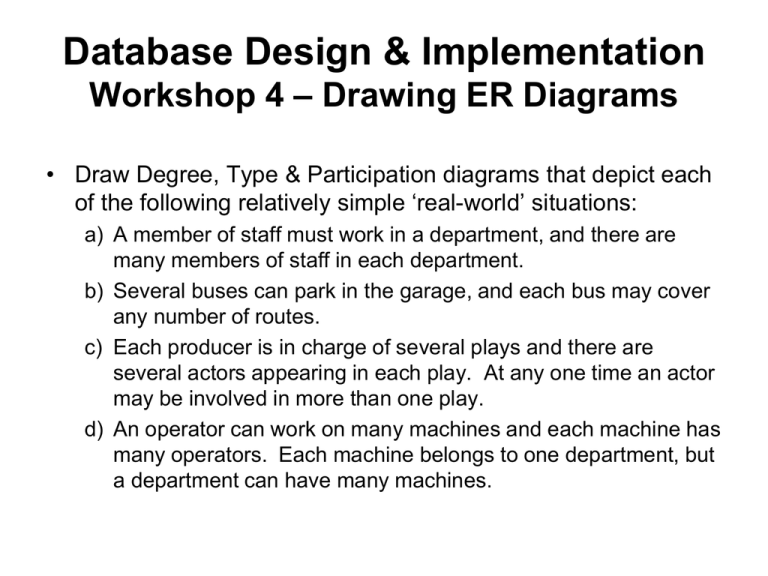
Database Design & Implementation Workshop 4 – Drawing ER Diagrams • Draw Degree, Type & Participation diagrams that depict each of the following relatively simple ‘real-world’ situations: a) A member of staff must work in a department, and there are many members of staff in each department. b) Several buses can park in the garage, and each bus may cover any number of routes. c) Each producer is in charge of several plays and there are several actors appearing in each play. At any one time an actor may be involved in more than one play. d) An operator can work on many machines and each machine has many operators. Each machine belongs to one department, but a department can have many machines. ER Diagram Elements Entity Entity = a singular noun, enclosed in a box. Relationship = a solid line, with rounded ends. type => <= type Type = a verb, or verb phrase. NB. MUST indicate the Type in BOTH directions. 1 Degree = only two possibilities. M Compulsion = a vertical line, within an Entity. a) A member of staff must work in a department, and there are many members of staff in each department. Staff Works in => M <= Employs 1 Department b) Several buses can park in the garage, and each bus may cover any number of routes. 1 Bus M parks in => <= holds 1 Garage M M Bus/route follows route => 1 Route <= is followed by c) Each producer is in charge of several plays and there are several actors appearing in each play. At any one time an actor may be involved in more than one play. Producer produces => 1 <= produced by M Play 1 features => M Pla/Ac 1 <= appear in M Actor d) An operator can work on many machines and each machine has many operators. Each machine belongs to one department, but a department can have many machines. Operator M works on => M 1 Op/Mach Machine <= Has many M <= Has many <= Belongs to 1 1 Department Begin the process of producing the ER Diagram that forms 40% of Assignment 1 • by: – Identifying ALL of the Entities; by reading the Case Study carefully. – Drawing Occurrence diagrams; in order to explore the Relationship between each Pair of Entities you have identified. – Testing the Relationship between each Pair of Entities; against one, or more, of the 10 questions at the back of the Case Study. • If you CAN NOT ‘answer’ all 10 of the questions, then you HAVE NOT: – either; identified ALL of the Entities. – and/or; explored ALL of the necessary Relationships.
