Measuring Up: Using Operational Reviews as a Departmental
advertisement
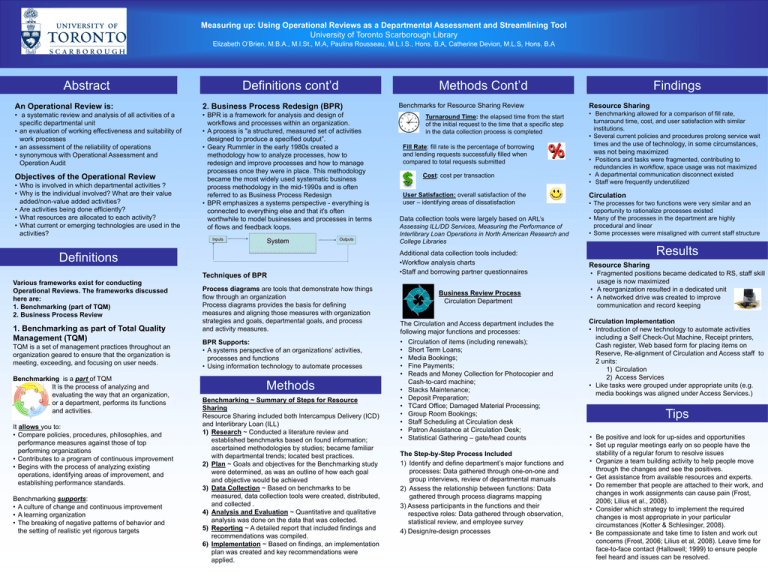
Measuring up: Using Operational Reviews as a Departmental Assessment and Streamlining Tool University of Toronto Scarborough Library Elizabeth O’Brien, M.B.A., M.I.St., M.A, Paulina Rousseau, M.L.I.S., Hons. B.A, Catherine Devion, M.L.S, Hons. B.A Definitions cont’d Abstract Methods Cont’d An Operational Review is: 2. Business Process Redesign (BPR) • a systematic review and analysis of all activities of a specific departmental unit • an evaluation of working effectiveness and suitability of work processes • an assessment of the reliability of operations • synonymous with Operational Assessment and Operation Audit • BPR is a framework for analysis and design of workflows and processes within an organization. • A process is "a structured, measured set of activities designed to produce a specified output”. • Geary Rummler in the early 1980s created a methodology how to analyze processes, how to redesign and improve processes and how to manage processes once they were in place. This methodology became the most widely used systematic business process methodology in the mid-1990s and is often referred to as Business Process Redesign • BPR emphasizes a systems perspective - everything is connected to everything else and that it's often worthwhile to model businesses and processes in terms of flows and feedback loops. Objectives of the Operational Review • Who is involved in which departmental activities ? • Why is the individual involved? What are their value added/non-value added activities? • Are activities being done efficiently? • What resources are allocated to each activity? • What current or emerging technologies are used in the activities? Inputs System Outputs Definitions Techniques of BPR Various frameworks exist for conducting Operational Reviews. The frameworks discussed here are: 1. Benchmarking (part of TQM) 2. Business Process Review 1. Benchmarking as part of Total Quality Management (TQM) TQM is a set of management practices throughout an organization geared to ensure that the organization is meeting, exceeding, and focusing on user needs. Benchmarking is a part of TQM It is the process of analyzing and evaluating the way that an organization, or a department, performs its functions and activities. It allows you to: • Compare policies, procedures, philosophies, and performance measures against those of top performing organizations • Contributes to a program of continuous improvement • Begins with the process of analyzing existing operations, identifying areas of improvement, and establishing performance standards. Benchmarking supports: • A culture of change and continuous improvement • A learning organization • The breaking of negative patterns of behavior and the setting of realistic yet rigorous targets Process diagrams are tools that demonstrate how things flow through an organization Process diagrams provides the basis for defining measures and aligning those measures with organization strategies and goals, departmental goals, and process and activity measures. BPR Supports: • A systems perspective of an organizations’ activities, processes and functions • Using information technology to automate processes Methods Benchmarking ~ Summary of Steps for Resource Sharing Resource Sharing included both Intercampus Delivery (ICD) and Interlibrary Loan (ILL) 1) Research ~ Conducted a literature review and established benchmarks based on found information; ascertained methodologies by studies; became familiar with departmental trends; located best practices. 2) Plan ~ Goals and objectives for the Benchmarking study were determined, as was an outline of how each goal and objective would be achieved 3) Data Collection ~ Based on benchmarks to be measured, data collection tools were created, distributed, and collected . 4) Analysis and Evaluation ~ Quantitative and qualitative analysis was done on the data that was collected. 5) Reporting ~ A detailed report that included findings and recommendations was compiled. 6) Implementation ~ Based on findings, an implementation plan was created and key recommendations were applied. Benchmarks for Resource Sharing Review Turnaround Time: the elapsed time from the start of the initial request to the time that a specific step in the data collection process is completed Fill Rate: fill rate is the percentage of borrowing and lending requests successfully filled when compared to total requests submitted Cost: cost per transaction User Satisfaction: overall satisfaction of the user – identifying areas of dissatisfaction Data collection tools were largely based on ARL’s Assessing ILL/DD Services, Measuring the Performance of Interlibrary Loan Operations in North American Research and College Libraries Additional data collection tools included: •Workflow analysis charts •Staff and borrowing partner questionnaires Business Review Process Circulation Department The Circulation and Access department includes the following major functions and processes: • • • • • • • • • • • • Circulation of items (including renewals); Short Term Loans; Media Bookings; Fine Payments; Reads and Money Collection for Photocopier and Cash-to-card machine; Stacks Maintenance; Deposit Preparation; TCard Office; Damaged Material Processing; Group Room Bookings; Staff Scheduling at Circulation desk Patron Assistance at Circulation Desk; Statistical Gathering – gate/head counts The Step-by-Step Process Included 1) Identify and define department’s major functions and processes: Data gathered through one-on-one and group interviews, review of departmental manuals 2) Assess the relationship between functions: Data gathered through process diagrams mapping 3) Assess participants in the functions and their respective roles: Data gathered through observation, statistical review, and employee survey 4) Design/re-design processes Findings Resource Sharing • Benchmarking allowed for a comparison of fill rate, turnaround time, cost, and user satisfaction with similar institutions. • Several current policies and procedures prolong service wait times and the use of technology, in some circumstances, was not being maximized • Positions and tasks were fragmented, contributing to redundancies in workflow, space usage was not maximized • A departmental communication disconnect existed • Staff were frequently underutilized Circulation • The processes for two functions were very similar and an opportunity to rationalize processes existed • Many of the processes in the department are highly procedural and linear • Some processes were misaligned with current staff structure Results Resource Sharing • Fragmented positions became dedicated to RS, staff skill usage is now maximized • A reorganization resulted in a dedicated unit • A networked drive was created to improve communication and record keeping Circulation Implementation • Introduction of new technology to automate activities including a Self Check-Out Machine, Receipt printers, Cash register, Web based form for placing items on Reserve, Re-alignment of Circulation and Access staff to 2 units: 1) Circulation 2) Access Services • Like tasks were grouped under appropriate units (e.g. media bookings was aligned under Access Services.) Tips • Be positive and look for up-sides and opportunities • Set up regular meetings early on so people have the stability of a regular forum to resolve issues • Organize a team building activity to help people move through the changes and see the positives. • Get assistance from available resources and experts. • Do remember that people are attached to their work, and changes in work assignments can cause pain (Frost, 2006; Lilius et al., 2008). • Consider which strategy to implement the required changes is most appropriate in your particular circumstances (Kotter & Schlesinger, 2008). • Be compassionate and take time to listen and work out concerns (Frost, 2006; Lilius et al, 2008). Leave time for face-to-face contact (Hallowell; 1999) to ensure people feel heard and issues can be resolved.
