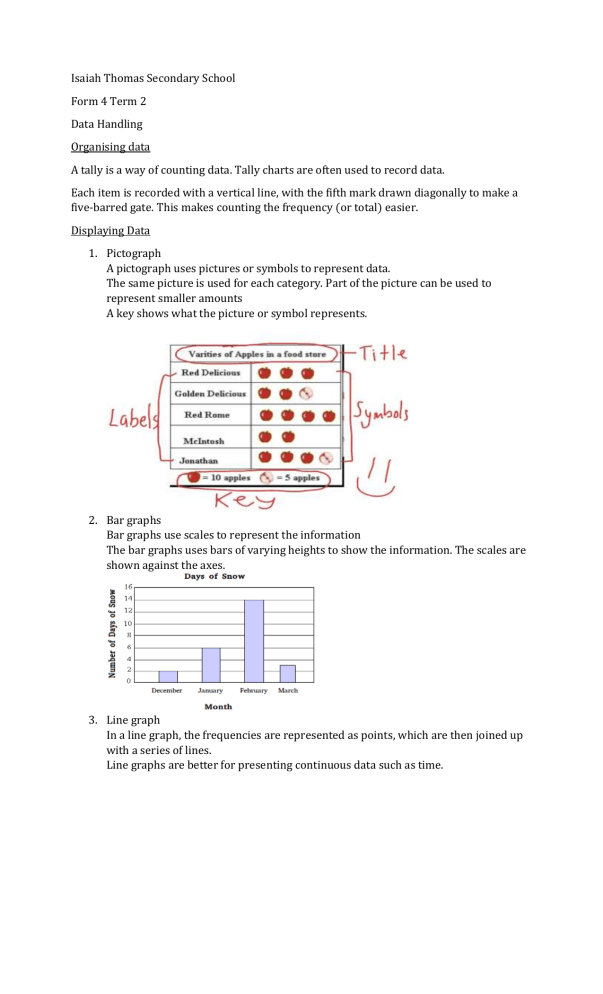
Isaiah Thomas Secondary School Form 4 Term 2 Data Handling Organising data A tally is a way of counting data. Tally charts are often used to record data. Each item is recorded with a vertical line, with the fifth mark drawn diagonally to make a five-barred gate. This makes counting the frequency (or total) easier. Displaying Data 1. Pictograph A pictograph uses pictures or symbols to represent data. The same picture is used for each category. Part of the picture can be used to represent smaller amounts A key shows what the picture or symbol represents. 2. Bar graphs Bar graphs use scales to represent the information The bar graphs uses bars of varying heights to show the information. The scales are shown against the axes. 3. Line graph In a line graph, the frequencies are represented as points, which are then joined up with a series of lines. Line graphs are better for presenting continuous data such as time.

