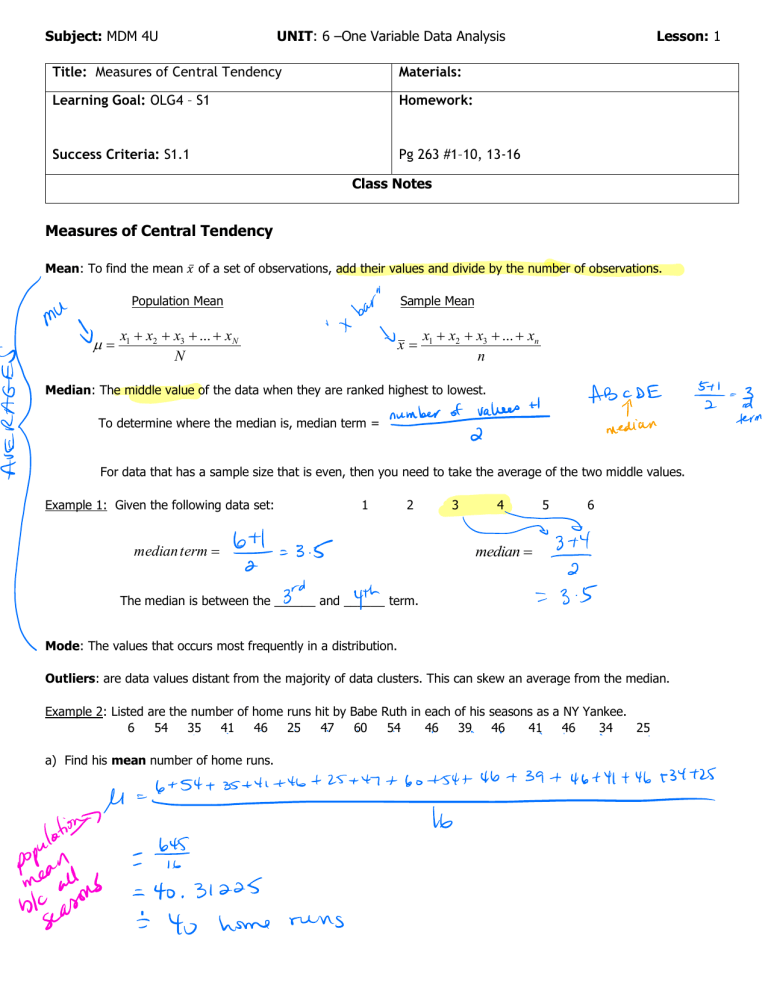
Subject: MDM 4U UNIT: 6 One Variable Data Analysis Title: Measures of Central Tendency Materials: Learning Goal: OLG4 S1 Homework: Success Criteria: S1.1 Pg 263 #1 10, 13-16 Lesson: 1 Class Notes Measures of Central Tendency Mean: To find the mean of a set of observations, add their values and divide by the number of observations. Population Mean x1 x2 Sample Mean x3 ... xN N x1 x x2 x3 ... xn n Median: The middle value of the data when they are ranked highest to lowest. To determine where the median is, median term = For data that has a sample size that is even, then you need to take the average of the two middle values. Example 1: Given the following data set: 1 2 median term 3 4 5 6 median The median is between the ______ and ______ term. Mode: The values that occurs most frequently in a distribution. Outliers: are data values distant from the majority of data clusters. This can skew an average from the median. Example 2: Listed are the number of home runs hit by Babe Ruth in each of his seasons as a NY Yankee. 6 54 35 41 46 25 47 60 54 46 39 46 41 46 34 25 a) Find his mean number of home runs. b) Find his median home runs hit in a year. First, organize data in ascending order 6 25 25 34 35 39 41 41 46 46 46 46 47 54 54 60 The median is between the ____________ term. c) Determine the mode: ___________ (most frequently occurring number) Consider: What causes the mean to be different from the median? If data points are close together, then there is an __________________ difference between the mean and median. They both measure the center of a distribution. An outlier may skew a mean, thus being the reason why the median is considered to being a better tool of the center of measure. Graphing Data Plotting data and drawing a smooth curve to fit the data can lead to the following distributions: Bimodal Probabilities can be computed by finding the area under the curve within the appropriate interval. The total area under the curve is equal to one. Example 3: Before heading on vacation to Mexico, you observe the actual high temperatures for seven days. Day 1 2 3 4 5 6 7 Temperature (oC) 27 29 32 29 45 29 31 a) Determine the mean median and mode. a) Mean = Median: 27 29 29 29 31 32 45 Mode = b) The weather report predicts that based on the previous seven-day forecast, the temperature on the day of our arrival should be 36oC. Is this weather report accurate? c) Is there an outlier in the data? How does it affect the measures of central tendency? d) Which measure of central tendency would best represent the temperatures of Mexico at this time? Grouped Data When a set of data has been grouped into intervals, you can approximate the mean using the formula: Population Grouped Mean i f i mi i fi where mi is the midpoint value of the interval and Sample Grouped Mean x i f i mi i fi f i s the frequency for that interval. Example 4: A group of children were asked how many hours a day they spend watching television. Determine the mean and median number of hours for this distribution. Number of Hours Number of Children, [0 1) 1 [1 2) 4 [2 3) 7 [3 4) 3 [4 5) 2 [5 6) 1 Number of Hours Midpoint, mi Number of Children, f i [0 1) 1 [1 2) 4 [2 3) 7 [3 4) 3 [4 5) 2 [5 6) 1 Cumulative Frequency, mi f i (Mean = ______, Median = ______ ) Weighted Mean: This gives a measure of central tendency that reflects the importance of the data. xw xw x1w1 i x2 w2 w1 w2 x3 w3 ... xn wn w3 ... wn xi w1 i w1 Example 5: A math department assigns the following weights for each category in its Advanced Functions course: Knowledge: 25% Project: 10% write the exam. a) Thinking: 10% Communication: 10% Application: 15% Exam: 30% irst five categories. She still needs to b) Is it possible for Catherine to receive a final mark of 90% in the course? Justify your answer.


