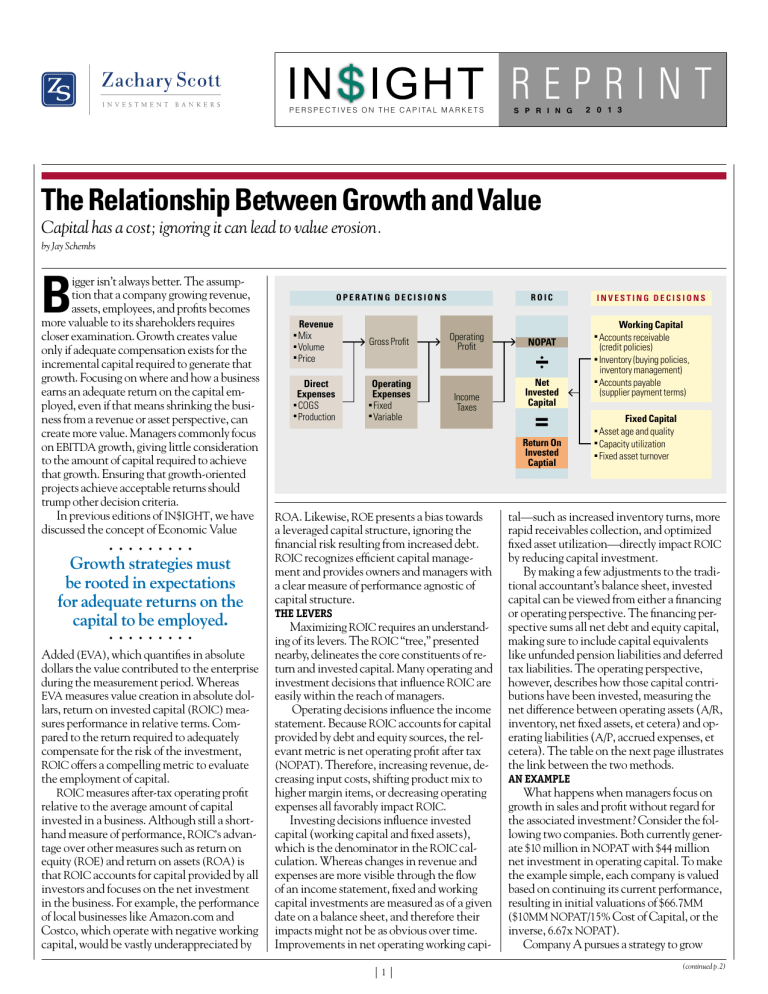
P E R S P E C T I V E S O N T H E C A P I TA L M A R K E T S REPRINT S P R I N G 2 0 1 3 The Relationship Between Growth and Value Capital has a cost; ignoring it can lead to value erosion. by Jay Schembs B igger isn’t always better. The assumption that a company growing revenue, assets, employees, and profits becomes more valuable to its shareholders requires closer examination. Growth creates value only if adequate compensation exists for the incremental capital required to generate that growth. Focusing on where and how a business earns an adequate return on the capital employed, even if that means shrinking the business from a revenue or asset perspective, can create more value. Managers commonly focus on EBITDA growth, giving little consideration to the amount of capital required to achieve that growth. Ensuring that growth-oriented projects achieve acceptable returns should trump other decision criteria. In previous editions of IN$IGHT, we have discussed the concept of Economic Value ......... Growth strategies must be rooted in expectations for adequate returns on the capital to be employed. ......... Added (EVA), which quantifies in absolute dollars the value contributed to the enterprise during the measurement period. Whereas EVA measures value creation in absolute dollars, return on invested capital (ROIC) measures performance in relative terms. Compared to the return required to adequately compensate for the risk of the investment, ROIC offers a compelling metric to evaluate the employment of capital. ROIC measures after-tax operating profit relative to the average amount of capital invested in a business. Although still a shorthand measure of performance, ROIC’s advantage over other measures such as return on equity (ROE) and return on assets (ROA) is that ROIC accounts for capital provided by all investors and focuses on the net investment in the business. For example, the performance of local businesses like Amazon.com and Costco, which operate with negative working capital, would be vastly underappreciated by O P E R AT I N G D E C I S I O N S n n n n n Revenue Mix Volume Price Gross Profit Direct Expenses COGS Production Operating Expenses Fixed Variable ROIC Operating Profit NOPAT INVESTING DECISIONS n n n n Income Taxes Net Invested Capital = Return On Invested Captial ROA. Likewise, ROE presents a bias towards a leveraged capital structure, ignoring the financial risk resulting from increased debt. ROIC recognizes efficient capital management and provides owners and managers with a clear measure of performance agnostic of capital structure. The Levers Maximizing ROIC requires an understanding of its levers. The ROIC “tree,” presented nearby, delineates the core constituents of return and invested capital. Many operating and investment decisions that influence ROIC are easily within the reach of managers. Operating decisions influence the income statement. Because ROIC accounts for capital provided by debt and equity sources, the relevant metric is net operating profit after tax (NOPAT). Therefore, increasing revenue, decreasing input costs, shifting product mix to higher margin items, or decreasing operating expenses all favorably impact ROIC. Investing decisions influence invested capital (working capital and fixed assets), which is the denominator in the ROIC calculation. Whereas changes in revenue and expenses are more visible through the flow of an income statement, fixed and working capital investments are measured as of a given date on a balance sheet, and therefore their impacts might not be as obvious over time. Improvements in net operating working capi1 n n n n Working Capital Accounts receivable (credit policies) Inventory (buying policies, inventory management) Accounts payable (supplier payment terms) Fixed Capital Asset age and quality Capacity utilization Fixed asset turnover tal—such as increased inventory turns, more rapid receivables collection, and optimized fixed asset utilization—directly impact ROIC by reducing capital investment. By making a few adjustments to the traditional accountant’s balance sheet, invested capital can be viewed from either a financing or operating perspective. The financing perspective sums all net debt and equity capital, making sure to include capital equivalents like unfunded pension liabilities and deferred tax liabilities. The operating perspective, however, describes how those capital contributions have been invested, measuring the net difference between operating assets (A/R, inventory, net fixed assets, et cetera) and operating liabilities (A/P, accrued expenses, et cetera). The table on the next page illustrates the link between the two methods. An Example What happens when managers focus on growth in sales and profit without regard for the associated investment? Consider the following two companies. Both currently generate $10 million in NOPAT with $44 million net investment in operating capital. To make the example simple, each company is valued based on continuing its current performance, resulting in initial valuations of $66.7MM ($10MM NOPAT/15% Cost of Capital, or the inverse, 6.67x NOPAT). Company A pursues a strategy to grow (continued p.2) I N S I G H T R E P R I N T S P R I N G 2 013 NOPAT, regardless of the investment required. To accomplish that, management begins relaxing credit terms to entice incremental sales, stocks increasing amounts of inventory, and orders new equipment in advance of projected revenue growth. Company B, on the other hand, pursues only high-ROIC projects, which result in lower revenue and profit growth. The above graphs illustrate the economic impact of these strategies. The shareholder value curve presents the results of each strategy. Company A’s focus on NOPAT growth requires substantial external capital. Company B, however is able to finance its growth internally (through operating profits), enabling the owner to extract capital from the business (represented by the downward-sloping cumulative external capital curve). Thus, although Company A has grown larger as measured by enterprise value, the owner of Company B is far wealthier as a result of the growth, the lower capital requirements, and receipt of distributions. By the 5th year, the additional capital required to fund Company A’s aggressive growth campaign has dragged the Company’s ROIC below its cost of capital, resulting in a decline in shareholder value. Growth can create shareholder value, but business owners must be cognizant of the implications that strategies solely focused on growth have on the balance sheet. In other words, growth strategies must be rooted in expectations for adequate returns on the capital employed. ROIC provides a clear and comparable measure of performance that recognizes that all cash flows are not created equal. Managers that are mindful of ROIC while evaluating growth strategies will increase the chances of generating real economic value in their businesses. v Accountant’s Balance Sheet Invested Capital/Financing Method Invested Capital/Operating Method Assets Cash...............................................1,500 A/R................................................ 8,000 Inventory..................................... 15,000 Current Assets............................ 24,500 Debt & Equivalents Line of Credit............................... 12,000 Long-Term Debt.......................... 18,000 Total Debt & Equivalents.............................. 30,000 Operating Current Assets A/R................................................ 8,000 Inventory..................................... 15,000 Total Operating Current Assets............................ 23,000 Net PP&E..................................... 33,000 Total Assets................................ 57,500 Equity & Equivalents Deferred Taxes.............................. 3,000 Equity.......................................... 12,500 Total Equity & Equivalents.............................. 15,500 Operating Current Liabilities A/P.................................................7,000 Accrued Expenses........................ 5,000 Total Operating Current Liabilities....................... 12,000 Gross Invested Capital......................................... 45,500 Net Operating Working Capital.......................... 11,000 Less Cash.......................................1,500 Long-Term Assets Net PP&E..................................... 33,000 Net Invested Capital............... 44,000 Net Invested Capital............... 44,000 Liabilities A/P.................................................7,000 Accrued Expenses........................ 5,000 Line of Credit............................... 12,000 Current Liabilities....................... 24,000 Long-Term Debt.......................... 18,000 Deferred Taxes.............................. 3,000 Total Liabilities............................ 45,000 Equity......................................... 12,500 Liabilities & Equity.................. 57,500 Invested Capital and Value $160,000 $140,000 $120,000 $100,000 $80,000 $60,000 $40,000 $20,000 0 -$20,000 -$40,000 -$60,000 Enterprise Value Cumulative External Capital Shareholder Value C O M PA N Y A Yr 1 Yr 2 C O M PA N Y B Yr 4 Yr 3 Yr 5 Yr 1 Yr 2 Yr 4 Yr 5 Yr 4 Yr 5 Yr 3 Return on Capital (ROIC) 26% Cost of Capital Return on Invested Capital (ROIC) 24% 22% 20% 18% 16% 14% 12% 10% C O M PA N Y B C O M PA N Y A Yr 1 Yr 2 Yr 3 Yr 4 Yr 5 Yr 1 Yr 2 Yr 3 ABOUT ZACHARY SCOTT Zachary Scott is an investment banking and financial advisory firm founded in 1991 to serve the needs of privately held, middle-market companies. The firm offers a unique combination of in-depth knowledge of the capital markets and industry competitive dynamics, sophisticated analytical capabilities, and proven expertise in structuring and negotiating complex transactions. For more information on Zachary Scott, please go to ZacharyScott.com. 1200 Fifth Avenue, Suite 1500 Seattle, Washington 98101 www.Zachar yScott.com Mark D. Working 206.224.7382 mworking@zacharyscott.com Michael T. Newsome 206.224.7387 mnewsome@zacharyscott.com Jay Schembs 206.838.5524 jschembs@zacharyscott.com William S. Hanneman 206.224.7381 bhanneman@zacharyscott.com Ray D. Rezab 206.224.7386 rrezab@zacharyscott.com Michael J. Black 206.838.5526 mblack@zacharyscott.com Frank S. Buhler 206.224.7383 fbuhler@zacharyscott.com Doug Cooper 206.224.7388 dcooper@zacharyscott.com 2

