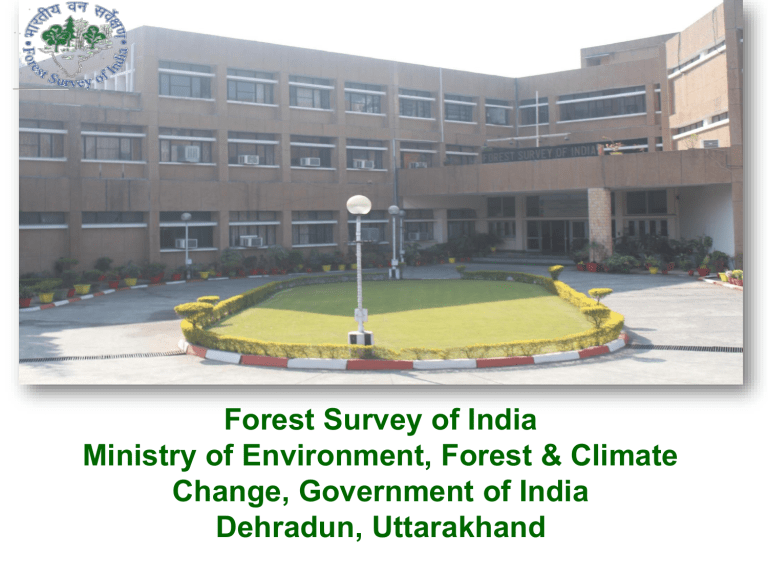
Forest Survey of India Ministry of Environment, Forest & Climate Change, Government of India Dehradun, Uttarakhand Forest Inventory & Biomass Estimation Presenter: Kamal Pandey (ISS-2008) Deputy Director, Forest Survey of India A. Forest Inventory 1. 2. 3. 4. 5. 6. 7. 8. Objective Designing Forest Inventory Sampling Design/Method Sample Size determination Sampling intensity Laying out Plots in field Estimation and Assessment Inventory Report B. Biomass Estimation 1. 2. 3. 4. 5. Basic Concepts Simple Indices of Biomass Estimator for Actual Biomass Estimation Sample Counts Assessment of Biomass in a Sample Plot Forest Inventory “Forest inventory refers to both the tabulated forest information and to the process of measuring and analyzing the data on which the tabulated information is based” (FAO 2010) Global : National: Local : International concern (GFRA) Strategic planning and policy making (NFI) Operative management (Working Plan) Capturing Information for further analysis in various field forms Forest Biometrics is science of forest (Bio) measurement (metrics). It is used to determine growth in a forest. The quantification of biological and physical characteristics information about trees can be made on various parameters as listed below: Species ,DBH, height, site quality, age, size, shape , insects, disease, wildlife, topography, soils , climate and various other parameters etc Steps/Object Inventory objectives/desired information Natural Resources Survey Assessment of potential for forest and wood based industry development Wood based industry feasibility study. Management plan for a forest - long term and short term. Development of sampling design and methods. Data collection (field surveys, remote sensing data analysis and other sources). Data analysis and publication of the results. Purpose & Scale of inventory are main factors determining the overall methodology. Cost and time constraints CHOICE OF THE KIND OF ENUMERATION Total or complete enumeration Partial (or sample) enumeration Extent of the area to be covered Variation in composition and density Intensity of management, degree of accuracy Resources of labour, time and funds available Ratio of sample to the whole population is called sampling fraction or intensity of sampling (expressed as %) eg 5%, 10% or 20%. For example; Sample of 100 ha selected from 1000 ha. Intensity of sampling is 10%. CHOICE OF THE KIND OF ENUMERATION • Total enumeration is carried where – Crop composition and density varies greatly (miscellaneous forests):- total enumerations – Smaller forest areas where Intensity of management (high), greater accuracy is required:- • Extensive areas and all other cases:- Partial or sample enumeration – Reduced cost, saving of time – Relative accuracy – Knowledge of error & greater scope • Resources of labour, time and funds available dictate which method of enumeration can be carried out. SAMPLING DESIGNS Objective of the inventory Desired precision Time and money available Topography & accessibility Availability of personnel and equipments Availability of satellite imageries, aerial photographs, and maps, data processing units. Results of previous survey Information of precision level desired, time and money available for the work provides the foundation for sampling design. Operational Efficiency SAMPLE SIZE DETERMINATION Optimum sample size is essential for any inventory design. Level of precision required (5–10% permissible error) Variability of main characteristic under study Through pilot survey Past study Correlated variable Cost of enumeration per sample plot Working Plan prescribes following factors for determination of sample size : Volume/ha Allowable error Time and Cost factor Refer: FSI’s Technical information Series (TISS) Volume 2 No. 3, 2020 on intensity of sample size. Determination of sample size Shape & Size of the Sampling Units/Plots Small sampling units (area of plots) are more efficient than larger ones Larger the number of independent sampling units (no. of plots) observed, the better the precision. Square and rectangular plots are most commonly used in forest surveys. Circular plot is very easy to lay on level ground once its center and radius are fixed. Usual size of the plots is 0.1 hectare but bigger plots of 1.0 hectare are often laid in mature crops. Working Plan prescribes laying out of 0.1ha square plot (NWPC, 2014) whereas Circular plots are laid as per NWPC 2023. Thumb rule: Size of sampling unit should be large enough to include at least 20 measurable trees. Sampling Random Sampling Non-aligned Systematic Sampling Aligned Systematic Sampling Cluster Sampling 13 Types of sampling plots Temporary sampling plots Permanent sampling plots Temporary sampling plots: Generally used for the enumeration surveys Measurements carried out once only Permanent sampling plots: forest dynamics Growth Parameters Permanent sample plots Permanent sampling plots can be used for: Repeated measurements at regular interval Used for preparation of yield tables. To study the all stages of development of even aged crop Including crop volume and increment. To study the same type of crops in different localities. To study the influence on crop increment of different methods of regeneration. Working Plan Code 2014 Inventory designs Working Plan is a written document : Describing the forests, Results of the past management practices and Proposal for the future forest management interventions for a forest area. Evidence based ‘Planning and Management Mechanism’ Working Plan Code 2014 plot design New NFI 2016 onwards & NWPC 2023 Coverage of NFI India map (5x5km grids) Sampling of grids on 5 yr cycle 1st yr – all 1s 2nd yr- all 3s 3rd yr – all 5s 4th yr – all 2s 5th yr- all 4s 6th yr- all 1s 5 1 2 3 4 5 1 2 3 1 2 3 4 5 1 2 3 4 2 3 4 5 1 2 3 4 5 3 4 5 1 2 3 4 5 1 4 5 1 2 3 4 5 1 2 5 1 2 3 4 5 1 2 3 1 2 3 4 5 1 2 3 4 2 3 4 5 1 2 3 4 5 3 4 5 1 2 3 4 5 1 4 5 1 2 3 4 5 1 2 5 1 2 3 4 5 1 2 3 1 2 3 4 5 1 2 3 4 2 3 4 5 1 2 3 4 5 3 4 5 1 2 3 4 5 1 4 5 1 2 3 4 5 1 2 5 1 2 3 4 5 1 2 3 National Forest Inventory • • • Assessment of forest resources at 95% precision for National Estimation (90% for Sub-National) Data needs of different organizations e.g NITI Aayog, Finance Commission, SFDs, Universities and Research Organisations International reporting e.g. GFRA, UNFCCC, NATCOM etc. (contd…) INDIA 5x5 km grids Inventory cycle duration • 05 years for forests and 10 years for TOF • Approx 100 variables recorded Outcomes of Invetory of Forest & TOF • • • • • • approx 7,000 forested & 10,000 TOF grids to be inventoried/ year estimate growing stock (stems and volume) inside and outside forest areas estimate biomass and carbon stock in the India’s forest estimate Growth and productivity inventory of Important NTFPs growing stock of bamboo estimate important characteristic of forest such as regeneration, grazing, fire incidence etc. New National Forest Inventory Design INDIA GRID 5Km x 5Km 8m 900 5m 40m 40 m 900 8m 40 40m 40m 8m Single Grid of 5Kmx 5Km 5m m 900 8m 900 5m 5m 40 m 60 m NFI Plot Design Concentric circular plots at a distance of 5.0m from center of sub-plot at 90° in east direction Stump & Dead wood (2.8m radius) Sub-Plot 2 Sample Tree Form Information Woody Litter, Shrubs, Climbers, Tree Regeneration (1.7m radius) Non clump forming bamboo Plot (half of subplot 2) Sub-Plot 1 (central sub plot) Herbs ( 0.6m radius) Sub-Plot 3 1mX1m plot for forest floor and soil at a distance of 20m from central sub plot Sub-Plot 4 PDF Form Information 21 Concentric circular plots at a distance of 5.0m from center of sub-plot at 90° in east direction Stump & Dead wood (2.8m radius) Sub-Plot 2 Sample Tree Form Information Non clump forming bamboo Plot (half of subplot 2) Woody Litter, Shrubs, Climbers, Tree Regeneration (1.7m radius) Herbs ( 0.6m radius) Sub-Plot 3 1mX1m plot for forest floor and soil at a distance of 20m from central sub plot Sub-Plot 1 (central sub plot) Sub-Plot 4 PDF Form Information F. No. 1. 2. 3. 4. 5. 6. Name 9. Plot Approach Form Plot Description Form Plot Enumeration Form Sample Tree Form Bamboo Clump Analysis Form Bamboo Enumeration and Analysis Form (nonclump forming) Bamboo Weight Form NTFPs (Herbs, Shrubs and Climbers) and Regeneration Form Soil and Forest Floor Carbon Form 10 Stump, Dead Wood and Woody Litter Form 7. 8. 22 Data Collection Soil depth Area under different land use classes Rockiness Humus Intensity of regeneration Origin of stand Incidence of fire Injuries to crop Crop Composition Grazing Bamboo density Presence of weeds Bamboo quality Presence of grass Soil erosion Plantation potential Etc. Size class Biotic influence 60m radius (1.13 ha) Circular plot for qualitative information like – land use, crop composition, origin of stand, fire incidence, soil, regeneration, grazing etc. Cluster of 4 sub-plots of 8m radius are for tree measurements like dbh, height, species name, crowndiameter etc. 23 Variables to be recorded in field forms Location / Accessibility • GPS Point (Latitude, Longitude, Altitude) • Legal status • Ownership • Land use • Agro-ecological Zone Layer Terrain Type • General topography • Altitude (m) • Slope (%) • Aspect • Rockiness Soil •Litter •Humus layer •Soil depth •Soil color •Soil texture / structure •Organic Carbon •Drainage Class •Soil erosion status Variables to be recorded in field forms Dendrometric Parameters • Origin of Stand • Crop Composition • Size Classes • Species • Dominance • DBH (Over bark) • Bark thickness (double) • Bark void • Tree height (total) • Merchantable height (bole height) • Dominant height/ Top height • Crown width NTFP species • • • • • • • • • • • • Dead trees, cause? Basal area (tree or stand) Bamboo Occurrence Bamboo Density, quality, regeneration Plantation potential Forest type Layer / strata Species under regeneration / herbs / shrubs Dead wood Rotten/missing cull Compacted crown length Clear bole height Medicinal plants Variables to be recorded in field forms (contd…) Forest Disturbances • Hazards • Forest fires • Wild animal damage • Girdling or illicit felling • Grazing • Lopping • Biotic/abiotic influences Water resources • Availability of stream • Distance from stream • Seasonal or perennial • Number of springs • Small water bodies Forest health and vitality • Presence of undergrowth • Presence of grass • Invasive species (two with extant) • Incidence of insects • Incidence of diseases • Mortality • Decay class Variables to be recorded in field forms (contd…) Status of regeneration • Intensity of regeneration • Species under regeneration • Vertical Stratification • Presence of wildlife habitats • Sustainable Forest Management • Growing Stock/biomass • Succession Stage • Conversion of Forest to Other Land Uses • Conversion of other land uses to forests • Forest utilization • NWFP collection Water utilization by nearby communities • Electricity generation • Fuel wood collection • Timber extraction (from plantations) • Cultural and religious importance • Presence of archaeological sites/monuments • Presence of religious places • Presence of religious important trees • Biodiversity /Forest regeneration • Name of the species and quantity Fields Forms (Forest Inventory) Field Form No. Item 1. Plot Approach Form 2. Plot Description Form 3. Plot Enumeration Form Description The information recorded in this field form describes how the plot was approached The information recorded in this field form pertains to the general description of forest on an area of 1.13 ha (2 ha) i.e. 60m (80m) radius around the centre of the plot. In this form data of trees above 10cm dbh and bamboo clumps are recorded which are found in all sub-plots of 8 m radius (0.1 ha) plot. 28 Fields Forms (Forest Inventory) – contd. Field Form No. 3. 4. Item Description In this form data on dominance of trees of 10cm and above, double bark thickness, Sample Tree Form tree height and crown width of trees are recorded from sub-plot 2 (north-quadrant (one-fourth area)) of the plot. In this form data of each individual culms occurring in certain selected clumps in the Bamboo Clump plot is recorded. Analysis Form 29 Fields Forms (Forest Inventory) – contd. Field Form No. Item 5. Bamboo Enumeration and Analysis Form (nonclump forming) Description In this form information is collected for non-clump forming bamboos occurring in the sample plot. 30 Fields Forms (Forest Inventory) – contd. Field Form No. 6. Item Description The data regarding herbs are collected from four square sub-plots of 0.6 m radius (1mx1m) laid out at 5m (30m from the centre of main plot) distance from centre of Herbs, Shrubs and all sub-plots. Similarly, the data regarding Regeneration Form shrubs and regeneration are collected from four square plots of 1.7 m radius (3mx3m) laid out at a distance of 5 m (30m from the centre of the main plots) from centre of all sub-plots. 31 Fields Forms (Forest Inventory) – contd. Field Form No. 7. Item Description For forest floor data fresh, partially and fully decomposed leaves, twigs and branches are collected from any of two sub-plots of 1mx1m laid Soil and Forest out at distance of 20m from centre of sub-plot 1 Floor Carbon (north-east and south-west corners of the main Form plot). For collection of soil sample data pits of (optional) 30cmx30cmx30cm in the above two plots are dug out and a composite sample of 200gms is collected for estimating soil carbon. 32 Fields Forms (Forest Inventory) – contd. Field Form No. 8. 9. Item Description Data is to be collected from all sub plots, in Stump, dead wood the concentric circular plots of size 1.7 m & woody litter Form (woody litter) and 2.8 m (stump and dead wood). (optional) Data is to be collected from all sub-plots, in Shrubs, climber & the concentric circular of size 0.6 m (Herbs) Herb biomass form & 1.7 (Shrubs & climbers). (optional) 33 Forest Inventory – Pre-requisities 0.Objectives 1.Past Records:-Working Plans having information (Growing Stock, Volume of wood, Tree species etc.) - FSI Reports (ISFR, TIS) 2. Resources:-Manpower -Finance -Equipment (tools) -Time-Line 3. Generation of Sample Size 4. Adequate Placing and Planning work 5. Analysis, Processing and Reporting of Results Lay out of Plots in field Laying out surround Demarcation of plot boundary Marking cross marks Numbering of trees in the plot Preparing a plot chart Showing layout of plot and trees in plot Surround: Area maintained around the Sample Plot All trees in the surround are generally marked by white paint rings. Boundary lines of the plot are selected so that as far as possible projections of the crowns of the border line trees fall within the plot Demarcation and Numbering: Boundary line of the plots selected and marked by trench around it (or at corners) by wooden post Thank You Visit us at: www.fsi.nic.in Kamal Pandey, ISS Deputy Director, Forest Survey of India Email id:- pandey.kamal@nic.in Whatsapp contact:- 0-9718671757

