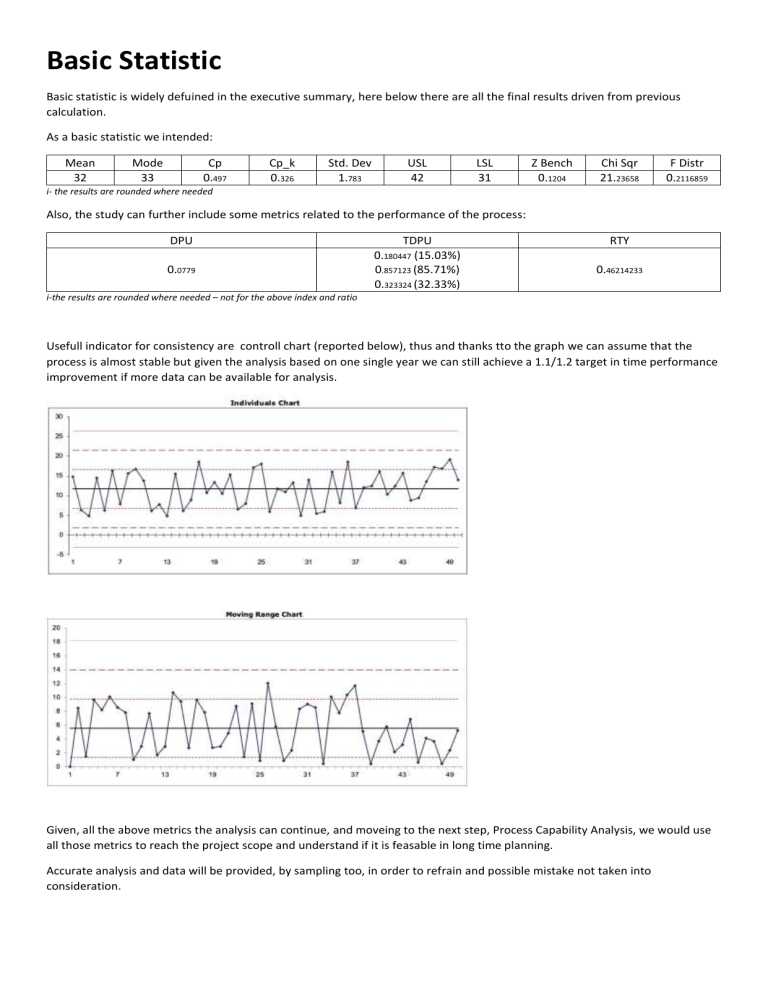
Basic Statistic Basic statistic is widely defuined in the executive summary, here below there are all the final results driven from previous calculation. As a basic statistic we intended: Mean 32 Mode 33 Cp 0.497 Cp_k 0.326 Std. Dev 1.783 USL 42 LSL 31 Z Bench 0.1204 Chi Sqr 21.23658 F Distr 0.2116859 i- the results are rounded where needed Also, the study can further include some metrics related to the performance of the process: DPU 0.0779 TDPU 0.180447 (15.03%) 0.857123 (85.71%) 0.323324 (32.33%) RTY 0.46214233 i-the results are rounded where needed – not for the above index and ratio Usefull indicator for consistency are controll chart (reported below), thus and thanks tto the graph we can assume that the process is almost stable but given the analysis based on one single year we can still achieve a 1.1/1.2 target in time performance improvement if more data can be available for analysis. Given, all the above metrics the analysis can continue, and moveing to the next step, Process Capability Analysis, we would use all those metrics to reach the project scope and understand if it is feasable in long time planning. Accurate analysis and data will be provided, by sampling too, in order to refrain and possible mistake not taken into consideration.


