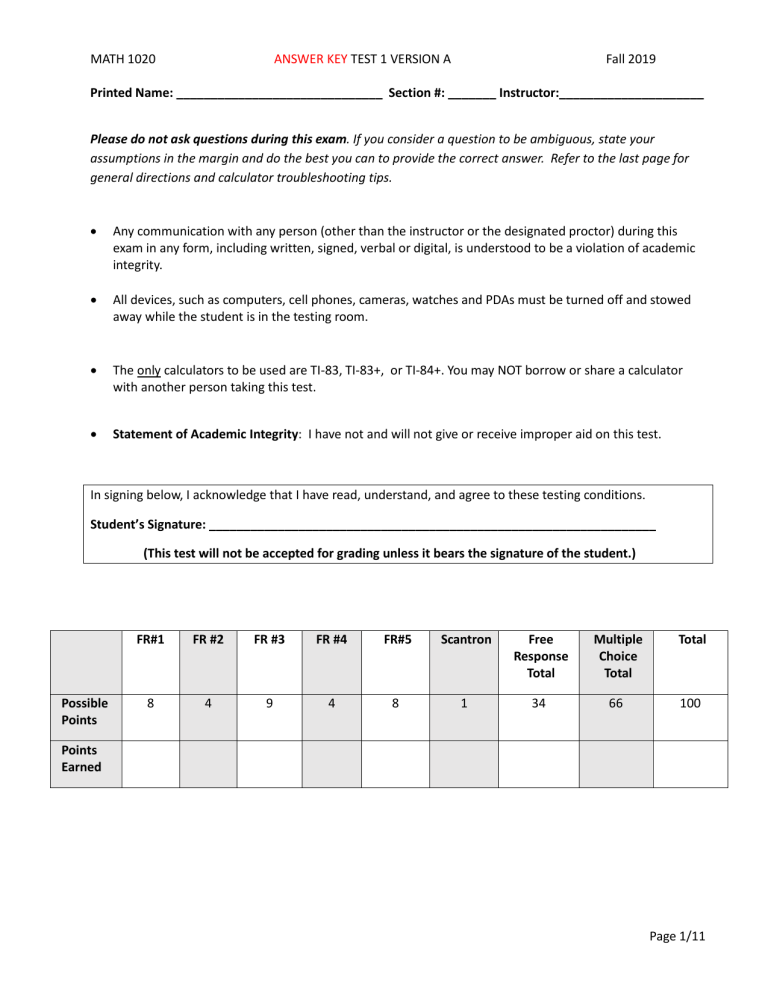
MATH 1020 ANSWER KEY TEST 1 VERSION A Fall 2019 Printed Name: ______________________________ Section #: _______ Instructor:_____________________ Please do not ask questions during this exam. If you consider a question to be ambiguous, state your assumptions in the margin and do the best you can to provide the correct answer. Refer to the last page for general directions and calculator troubleshooting tips. • Any communication with any person (other than the instructor or the designated proctor) during this exam in any form, including written, signed, verbal or digital, is understood to be a violation of academic integrity. • All devices, such as computers, cell phones, cameras, watches and PDAs must be turned off and stowed away while the student is in the testing room. • The only calculators to be used are TI-83, TI-83+, or TI-84+. You may NOT borrow or share a calculator with another person taking this test. • Statement of Academic Integrity: I have not and will not give or receive improper aid on this test. In signing below, I acknowledge that I have read, understand, and agree to these testing conditions. Student’s Signature: _________________________________________________________________ (This test will not be accepted for grading unless it bears the signature of the student.) Possible Points FR#1 FR #2 FR #3 FR #4 FR#5 Scantron Free Response Total Multiple Choice Total Total 8 4 9 4 8 1 34 66 100 Points Earned Page 1/11 MATH 1020 ANSWER KEY TEST 1 VERSION A Fall 2019 MULTIPLE CHOICE: 66 points Use a #2 pencil and completely fill each bubble on your scantron to answer each multiple choice question. (For future reference, circle your answers on this test paper.) There is no penalty for guessing on multiple choice. If you indicate more than one answer, or you leave a blank, the question will be marked as incorrect. Each question is worth 3 points, unless otherwise indicated. B D A D B C A B D B C A B A C D C B D A A C _____________________________________________________________________________________ 1. In 1999 there were 34.742 thousand new cases of Leukemia. From 1999 until 2016, the number of Leukemia cases has increased by 1.01 thousand new cases per year. Write a completely defined model for the given information. a.= L( x) 34.742 x + 1.01 thousand cases gives the number of new Leukemia cases, x years since 1999, 0 ≤ x ≤ 17 . b. L= ( x) 1.01x + 34.742 thousand cases gives the number of new Leukemia cases, x years since 1999, 0 ≤ x ≤ 17 . c. L= ( x) 1.01x + 34.742 thousand cases gives the number of new Leukemia cases, x years since 1999, 1999 ≤ x ≤ 2016 . d.= L( x) 34.742 x + 1.01 thousand cases gives the number of new Leukemia cases, x years since 1999, 1999 ≤ x ≤ 2016 . 2. Which one of the following does NOT describe a function? a. The surface area of a sphere is equal to four times pi times the square of the radius of the sphere. b. The cumulative sales of Examplesoft products are given by s= (t ) 300t + 1000 units where t is the number of years since 2003. 0 ≤ t ≤ 12 . c. x 1 2 3 4 5 f ( x) 1 1 2 3 5 d. r 1 1 2 2 3 g (r ) -2 2 -6 6 -9 Page 2/11 C MATH 1020 ANSWER KEY TEST 1 VERSION A Fall 2019 _________________________________________________________________________________________ Use the given information for the next three questions. [2 pts each] C (t ) = −0.067t + 1.119 million cars gives the number of cars that were stolen in the US, t years since 2005, Checkpoint: C (2) = 0.985 0≤t ≤9. 3. State and interpret the slope of the equation in the above model. a. -0.067; The number of cars stolen decreased by 0.067 million cars per year between 2005 and 2014. b. -0.067; In 2005, there were 0.067 million cars stolen in the US. c. 1.119; The number cars stolen increased by 1.119 million cars per year between 2005 and 2014. d. 1.119; In 2005, there were 1.119 million cars stolen in the US. 4. State and interpret the y-intercept of the equation in the above model. a. -0.067; The number of cars stolen decreased by 0.067 million cars per year between 2005 and 2014. b. -0.067; In 2005, there were 0.067 million cars stolen in the US. c. 1.119; The number cars stolen increased by 1.119 million cars per year between 2005 and 2014. d. 1.119; In 2005, there were 1.119 million cars stolen in the US. 5. How many cars were stolen in 2010? Does this question use extrapolation or interpolation? a. 0.784 million cars; Extrapolation b. 0.784 million cars; Interpolation. c. 0.449 million cars; Extrapolation. d. 0.449 million cars; Interpolation. _________________________________________________________________________________________ 6. For a function g ( x) that is continuous everywhere on its domain (−∞, ∞) , lim g ( x) = 0 means that the graph of g ( x) _____________________. x →∞ a. increases without bound as x-values approach 0 b. has a vertical asymptote c. has a horizontal asymptote d. increases without bound as x-values increase without bound Page 3/11 MATH 1020 ANSWER KEY TEST 1 VERSION A Fall 2019 _______________________________________________________________________________________ Use the given information for the next two questions. ( Atmospheric pressure is given by p ( x) 101, 325.0 1 − 2.256(10−5 ) x = meters, 0 ≤ x ≤ 15, 000 . ) 5.256 Pascals where x is the altitude in Checkpoint: p (1, 000) = 89,873.203 7. Complete the following statements by filling in the blanks. The input units are ___________________ and input description is ___________________________. The output units are __________________ and output description is _________________________. a. Meters, altitude; Pascals, atmospheric pressure b. Meters, atmospheric pressure; Pascals, altitude c. Pascals, atmospheric pressure; Meters, altitude d. Pascals, altitude; Meters, atmospheric pressure 8. Use the calculator to examine the graph of p ( x) on the given input data range. Describe the direction and concavity of the graph. a. decreasing and concave down b. decreasing and concave up c. increasing and concave down d. increasing and concave up _________________________________________________________________________________________ 9. Consider the two given functions. Choose the exponential decay function and then find the percentage change for the exponential decay function. f ( x) = 0.092(0.334) x a. 4.5% b. -33.4% g ( x) = 0.531(1.045) x c. -90.8% d. -66.6% 10. The number of bowling shoes sold in the US was 1.2 million units in 2015, but the quantity sold decreased by approximately 2.9% each year between 2015 and 2018. Find the best equation to complete the following model. __________________________________million units gives the number of bowling shoes sold in the US, x years since 2015, 0 ≤ x ≤ 4 . a. S ( x) = 1.2(1.029) x c. S ( x= ) 1.2 − 1.029 x b. S ( x) = 1.2(0.971) x d. S= ( x) 1.2 x − 0.029 Page 4/11 MATH 1020 ANSWER KEY TEST 1 VERSION A Fall 2019 _________________________________________________________________________________________ Use the given information for the next two questions. In a certain lake, the bass feed primarily on minnows and the minnows feed on plankton. The size of the bass population is f (n) bass where n is the number of minnows in the lake. The size of the minnow population is n( x) minnows where x is the number of plankton in the lake. 11. Which one of the following functions represents a meaningful new function from the given functions? a. f (n) ⋅ n( x) b. f (n) + n( x) c. f (n( x)) d. n( x( f )) 12. What are the output units for the new meaningful function? a. Bass b. Minnows c. Plankton d. Bass per plankton _________________________________________________________________________________________ Use the given information for the next two questions. 13. At a certain coffee shop, yearly sales of French-vanilla lattes can be modeled as S ( x) hundred lattes, when the price is x dollars per latte. What is the yearly revenue from the sale of French-vanilla lattes? a. S ( x) b. x ⋅ S ( x) c. S ( x) x d. x + S ( x) 14. What are the output units for the yearly revenue from the sale of French-vanilla lattes? a. hundred dollars b. hundred lattes c. dollars d. dollars per latte ________________________________________________________________________________________ Page 5/11 MATH 1020 ANSWER KEY TEST 1 VERSION A 15. What does the table suggest that Fall 2019 lim g ( x) =_____________ ? x g ( x) 2.9 4.01 2.99 4.001 2.999 4.0001 2.9999 4.00001 x →3− a. 2 b. 3 c. 4 d. does not exist 16. The table below gives the population of the world at various time during the 20th century and can be used to find an exponential function p (t ) that models the world population p in year t . Year 1910 1930 1950 1970 1990 Population (million people) 1750 2070 2520 3700 5300 Find a logarithmic function that models the inverse of p (t ) . a. t ( p ) = −640,392.039 + 84,939.844 ln( p ) b. t ( p ) = 1,887.282(1.0000106215 ) p −9 c. t ( p ) = 4.047(10 )(1.014 ) P d. t ( p ) 1,399.785 + 69.251ln( p ) = 17. Which one of the functions could have lim+ f ( x) = −∞ and lim f ( x) = ∞ ? x→ 0 a. linear b. cubic x→ ∞ c. logarithmic d. logistic Page 6/11 MATH 1020 ANSWER KEY TEST 1 VERSION A Fall 2019 _____________________________________________________________________________________ Use the given graph of f ( x) to answer the next two questions. 18. Explain mathematically why f ( x) has a vertical asymptote at x = 2. a. lim− f ( x) does not exist x→2 b. lim+ f ( x) = −∞ x→2 c. lim f ( x) = 2 x →∞ d. lim f ( x) = 2 x →−∞ 19. f ( x) is not continuous at x = −4 because _______________________________. a. f (−4) is undefined b. lim − f ( x) does not exist c. lim + f ( x) does not exist d. lim − f ( x) ≠ lim + f ( x) x→ −4 x→ −4 x→ −4 x→ −4 ________________________________________________________________________________________ 2 20. Which of the following statements is TRUE about a function of the form f ( x) = ax + bx + c for a < 0 ? a. The output values increase to a maximum value and then decrease. b. The graph changes concavity from concave down to concave up. c. The graph has a horizontal asymptote. d. The outputs value increase without bound as x increases without bound. Page 7/11 MATH 1020 ANSWER KEY TEST 1 VERSION A Fall 2019 _______________________________________________________________________________________ Use the given information for the next two questions. The spread of virus through a student population can be modeled by V (d ) = 300.525 , where 1 + 4,999.0 e −0.8 d V (d ) is the total number of students infected after d days, 5 ≤ d ≤ 20 . Checkpoint: V (2) = 0.297 21. It appears that there exists a day where the number of students infected was increasing most rapidly. This can be verified on the graph of V by taking note of____________________________. a. the change in concavity from concave up to concave down, as the number of days increase. b. the change in concavity from concave down to concave up, as the number of days increase. c. the maximum value. d. the end behavior of V . 22. The function V (d ) = 300.525 has horizontal asymptotes _______________________. 1 + 4,999.0 e −0.800 d a. y 4,999.0; = = y 0 b. y 300.525; = = y 4,999.0 c.= y 0;= y 300.525 d.= y 0;= y 0.800 _______________________________________________________________________________________ 23. The table below shows a company’s profit from the sale of sport utility vehicles (SUVs). Describe the behavior suggested by the scatter plot of the data and list the type of function(s) that best exhibit this behavior. SUVs (in millions) 10 20 30 40 50 60 Profit (in trillion dollars) 0.9 3.1 4.3 5.2 5.8 6.2 a. The scatter plot of the data is increasing and has no concavity is shown; linear. b. The scatter plot is increasing and is concave up; quadratic or exponential growth. c. The scatter plot of the data is increasing and is concave down; logarithmic or quadratic. d. The scatter plot is increasing and appears to have an inflection point; cubic or logistic. Page 8/11 MATH 1020 ANSWER KEY TEST 1 VERSION A Fall 2019 FREE RESPONSE: 34 points Show work where possible. Read the directions at the back of the test on rounding, inclusion of units, and writing models and sentences. 1. r (t= ) 0.5t 2 − 2t + 5 million dollars gives the cumulative revenue for Widgit Company, LLC, where t is the number of years since the start of the business at the end of 2000, 3 ≤ t ≤ 18 . Checkpoint: r (2) = 3 a. When, after the start of the business, did cumulative revenue first hit 70 million dollars? Find the answer correct to three decimal places. a. 2 pts first blank; 2 pts second blank b. 2 pts c. 2 pts Note: A negative solution to the equation doesn’t make sense in the context of the problem. __13.576 ___ In what month and year did the cumulative revenue first hit 70 million dollars? __July 2014__ Since 0.576x12=6.912 b. According to the model, what is the predicted cumulative revenue for Widgit Company, LLC at the end of 2020? Round to three decimal places and include units with the answer. 165.000 million dollars, since r (20) = 165 c. Write the following statement in function notation. At the end of 2004 the cumulative revenue earned by WidgitCo was 5 million dollars. r (4) = 5 ( _______ / 8 pts ) 2. P (c) billion units gives the production level at a factory, when c million dollars in capital is invested. Write a sentence of interpretation for P (10) = 27.982 . When 10 million dollars in capital is invested, the production level at a factory is 27.982 billion units. 1 pt when 1 pt what 2 pt how much, with units ( _______ / 4 pts ) Page 9/11 MATH 1020 ANSWER KEY TEST 1 VERSION A Fall 2019 3. Solar power has seen much growth in the recent past. The table show the number of US solar photovoltaic (PV) installations (residential, non-residential and utilities), which are a type of solar energy generator. Year 2006 2008 2010 2012 2014 Solar PV installations, in thousands 0.105 0.298 0.852 2.388 6.201 a. Look at scatter plot of the data. How many concavities are suggested by the scatter plot of the data? Circle one: 0 1 2 b. Align the input to the number of years since 2000. Write a completely defined exponential model for the newly aligned data. Part a) 1 pt Part b) 4 pts function equation 1 pt output units f ( x) = 0.005(1.668x ) thousand installations gives the number of solar 1 pt output description 1.5 pt input units and PV installations in the US homes, x years since 2000, 6 ≤ x ≤ 14 . description 0.5 pts input data range ( _______ / 9 pts ) 4. Fill in the blanks using as many of the six functions that apply. Linear Exponential Logarithmic Quadratic Cubic Logistic a. Name any and all of the functions that have exactly one vertical asymptote: _____LOGARITHMIC_____________________________________ a. 2 pts b. 2 pts. b. Name any and all of the functions that have exactly one horizontal asymptote: ____EXPONENTIAL_______________________________________ ( _______ / 4 pts ) Page 10/11 MATH 1020 ANSWER KEY TEST 1 VERSION A Fall 2019 5. Refer to the graph of f ( x) , graphed below on (−∞, ∞) , to answer the following questions. For part f), write an answer of ∞ , −∞ , or a number L, if appropriate. If the answer “does not exist” or is “undefined”, write “dne”. a. Mark an “X” directly on the graph (not the x-axis) at any and all inflection points b. Name all intervals on which the function is increasing. (15,125 ) c. Name all intervals on which the function is decreasing. ( −∞,15 ) , (125, ∞ ) d. Name all intervals on which the function is concave up. ( −∞, 70 ) a. 1 pt b. 1 pt c. 2 pts d. 1 pt e. 1 pt f. 2 pts e. Name all intervals on which the function is concave down. ( 70, ∞ ) f. Find the limits: lim f ( x) = __ ∞ ___ x → −∞ and lim f ( x) = __ − ∞ ___ x→ ∞ ( _______ / 8 pts ) 6. A scantron correctly bubbled with a #2 pencil, a correctly-bubbled XID, a correctly-bubbled test version, AND a signed academic integrity statement (on the front of the test) earns 1 point. --- END OF TEST -Page 11/11 MATH 1020 ANSWER KEY TEST 1 VERSION A Fall 2019 General Directions: • Show work where possible. Answers without supporting work (where work is appropriate) may receive little credit. • Do not round intermediate calculations. • Answers in context ALWAYS require units. • Assume end of the year data unless stated otherwise. • Round your answers to 3 decimal places UNLESS the answer needs to be rounded differently to make sense in the context of the problem OR the directions specify another type rounding OR the complete answer has fewer than 3 decimal places. • When asked to write a model, include all components of a model: an equation, a description of the input including units, a description of the output including units, and the input interval when known. • When asked to write a sentence of practical interpretation, answer the questions: when?, what?, and how much? using ordinary, conversational language. DO NOT use math words, terms, or unnecessary phrases. • Always use a ruler when estimating values off of a graph. HINTS FOR TROUBLESHOOTING YOUR CALCULATOR: • If you lose your L1, L2, etc., you may reinsert them using STAT 5 (set-up editor) enter. • The SCATTER PLOT will not show unless Plot 1 has been turned on and there is data in L1 and L2. • ZOOM 0 may not work for graphing if Plot 1 is turned on. • DIM MISMATCH error usually means that the lists in L1 and L2 are not of equal length. • DATA TYPE error usually means that you already have something in Y1 and you need to clear it before you can paste a new equation. • INVALID DIM error usually means that your plot(s) are on, but that you have no data in the lists. Refer to the second hint above. • If your batteries die, raise your hand and hold up your calculator. If your instructor has an extra calculator available, he/she will loan it to you for a few minutes. • SYNTAX ERROR: Try GO TO. This will happen if you use a subtraction minus sign when you should use a negative sign. • MATH SOLVER only works if there is a variable “x” in Y1. • If you need to CLEAR MEMORY, use 2nd +, 7:Reset, 1:All Ram, 2:Reset Page 12/11

