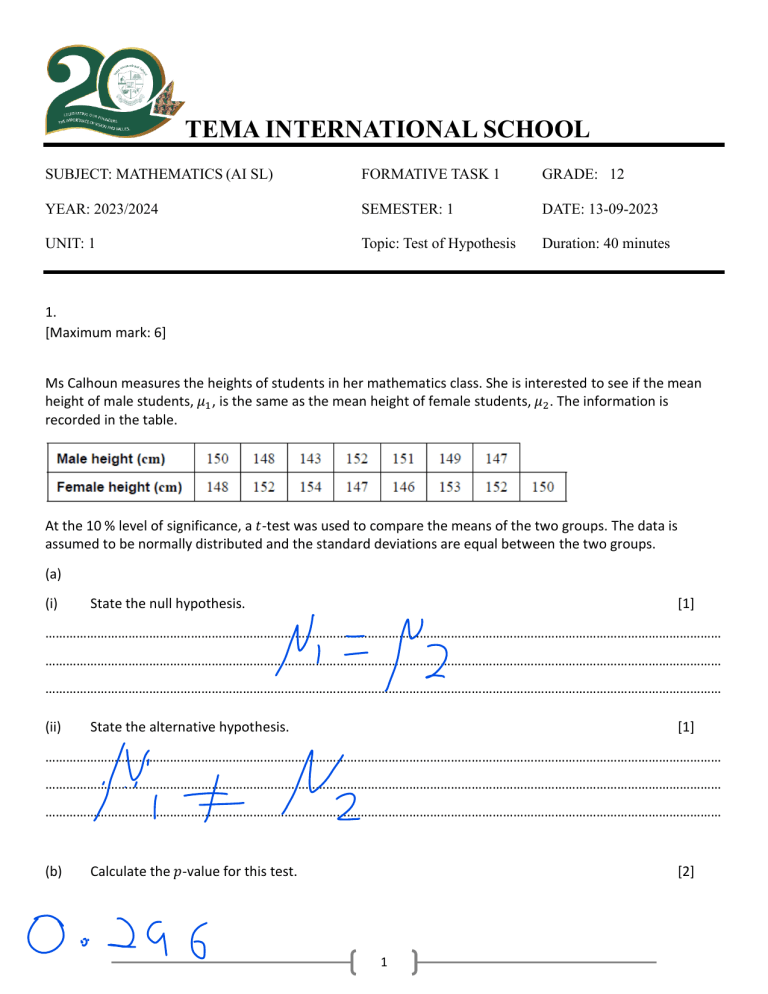
TEMA INTERNATIONAL SCHOOL SUBJECT: MATHEMATICS (AI SL) FORMATIVE TASK 1 GRADE: 12 YEAR: 2023/2024 SEMESTER: 1 DATE: 13-09-2023 UNIT: 1 Topic: Test of Hypothesis Duration: 40 minutes 1. [Maximum mark: 6] Ms Calhoun measures the heights of students in her mathematics class. She is interested to see if the mean height of male students, 𝜇1 , is the same as the mean height of female students, 𝜇2 . The information is recorded in the table. At the 10 % level of significance, a 𝑡-test was used to compare the means of the two groups. The data is assumed to be normally distributed and the standard deviations are equal between the two groups. (a) (i) State the null hypothesis. [1] …………………………………………………………………………………………………………………………………………………………………………… …………………………………………………………………………………………………………………………………………………………………………… …………………………………………………………………………………………………………………………………………………………………………… (ii) State the alternative hypothesis. [1] …………………………………………………………………………………………………………………………………………………………………………… …………………………………………………………………………………………………………………………………………………………………………… …………………………………………………………………………………………………………………………………………………………………………… (b) Calculate the 𝑝-value for this test. [2] 1 (c) State, giving a reason, whether Ms Calhoun should accept the null hypothesis. [2] …………………………………………………………………………………………………………………………………………………………………………… …………………………………………………………………………………………………………………………………………………………………………… …………………………………………………………………………………………………………………………………………………………………………… 2. [Maximum mark: 11] In an effort to study the level of intelligence of students entering college, a psychologist collected data from 4000 students who were given a standard test. The predictive norms for this particular test were computed from a very large population of scores having a normal distribution with mean 100 and standard deviation of 10. The psychologist wishes to determine whether the 4000 test scores he obtained also came from a normal distribution with mean 100 and standard deviation 10. He prepared the following table (expected frequencies are rounded to the nearest integer): (a) Copy and complete the table, showing how you arrived at your answers. [5] (b) Test the hypothesis at the 5% level of significance. [6] 2 3. [Maximum mark: 9] Casanova restaurant offers a set menu where a customer chooses one of the following meals: pasta, fish or shrimp. The manager surveyed 150 customers and recorded the customer’s age and chosen meal. The data is shown in the following table. A 𝜒 2 test was performed at the 10% significance level. The critical value for this test is 4.605. (a) State H0 , the null hypothesis for this test. [1] …………………………………………………………………………………………………………………………………………………………………………… …………………………………………………………………………………………………………………………………………………………………………… …………………………………………………………………………………………………………………………………………………………………………… (b) Write down the number of degrees of freedom. [1] …………………………………………………………………………………………………………………………………………………………………………… …………………………………………………………………………………………………………………………………………………………………………… …………………………………………………………………………………………………………………………………………………………………………… (c) Show that the expected number of children who chose shrimp is 31, correct to two significant figures. [2] …………………………………………………………………………………………………………………………………………………………………………… …………………………………………………………………………………………………………………………………………………………………………… …………………………………………………………………………………………………………………………………………………………………………… …………………………………………………………………………………………………………………………………………………………………………… (d) Write down (i) the 𝜒 2 statistic. [2] (ii) the 𝑝-value. [1] 3 (e) State the conclusion for this test. Give a reason for your answer. [2] …………………………………………………………………………………………………………………………………………………………………………… …………………………………………………………………………………………………………………………………………………………………………… …………………………………………………………………………………………………………………………………………………………………………… …………………………………………………………………………………………………………………………………………………………………………… 4


