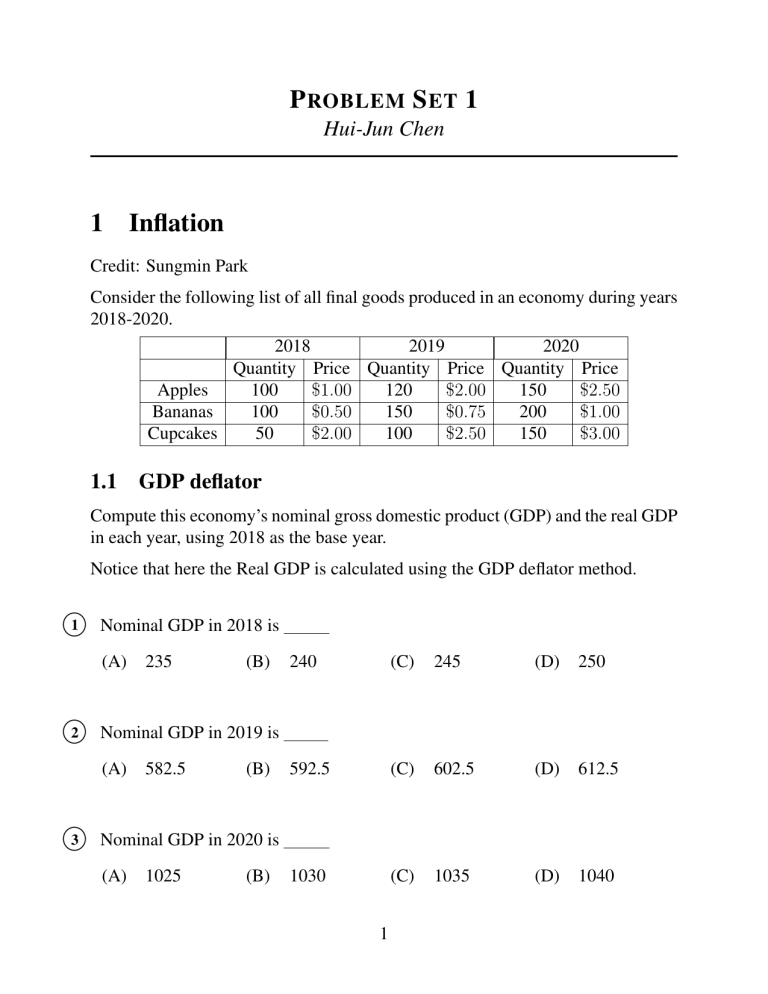
P ROBLEM S ET 1 Hui-Jun Chen 1 Inflation Credit: Sungmin Park Consider the following list of all final goods produced in an economy during years 2018-2020. 2018 2019 2020 Quantity Price Quantity Price Quantity Price Apples 100 $1.00 120 $2.00 150 $2.50 Bananas 100 $0.50 150 $0.75 200 $1.00 Cupcakes 50 $2.00 100 $2.50 150 $3.00 1.1 GDP deflator Compute this economy’s nominal gross domestic product (GDP) and the real GDP in each year, using 2018 as the base year. Notice that here the Real GDP is calculated using the GDP deflator method. 1 ⃝ Nominal GDP in 2018 is (A) 2 ⃝ (B) 240 (C) 245 (D) 250 592.5 (C) 602.5 (D) 612.5 1030 (C) 1035 (D) 1040 Nominal GDP in 2019 is (A) 3 ⃝ 235 582.5 (B) Nominal GDP in 2020 is (A) 1025 (B) 1 4 ⃝ Real GDP in 2018 is (A) 5 ⃝ (C) 245 (D) 250 390 (B) 395 (C) 400 (D) 405 540 (B) 545 (C) 550 (D) 555 155.63 (C) 152.63 (D) 163.52 186.42 (C) 186.36 (D) 166.42 GDP deflator in 2019 is (A) 8 ⃝ 240 Real GDP in 2020 is (A) 7 ⃝ (B) Real GDP in 2019 is (A) 6 ⃝ 235 152.53 (B) GDP deflator in 2020 is (A) 166.36 1.2 CPI (B) Continuing to using 2018 as the base year, What is the Consumer Price Index (CPI) in 2019 and 2020? 9 ⃝ CPI in 2019 is (A) 10 ⃝ 155 (B) 160 (C) 165 (D) 170 (B) 200 (C) 300 (D) 400 CPI in 2020 is (A) 100 2 After calculating the CPI, the inflation formula is: Inflation = percentage change in CPI = CP It − CP It−1 × 100. CP It−1 What are the inflation rates in 2019 and 2020 based on the CPI? 11 ⃝ Inflation rate in 2019 is (A) 12 ⃝ 30% (B) 40% (C) 50% (D) 60% 20% (C) 25% (D) 30% Inflation rate in 2020 is (A) 15% (B) 1.3 COVID shock 2021 Quantity Price Apples 150 $3.00 Bananas 200 $5.60 Cupcakes 150 $7.00 What is the CPI and inflation rate in 2021 using 2018 as base year? 13 ⃝ CPI in 2021 is (A) 14 ⃝ (B) 565 (C) 584 (D) 465 142% (C) 20% (D) 42% Inflation rate in 2021 is (A) 15 ⃝ 484 120% (B) Comparing Inflation in 2021 and 2020. Is 2021 experiencing an inflation or deflation? (A) deflation (B) stagflation 3 (C) inflation 2 Employment Credit: Sungmin Park 16 ⃝ Let u denote the unemployment rate of an economy. Let e denote the fraction of adult population that is employed. What is the labor-force participation rate written in terms of u and e? (A) 1−u e (B) 1−e u (C) 4 e 1−u (D) u 1−e 3 Computer Exercise Credit: Mike Carter One of the most important measurements of economic output is Gross Domestic Product. This question asks you to find information about GDP for a few selected time periods to get you some practice using official data. The data we will use is accessible at http://FRED.StLouisFed.org . • To get to Real GDP, click “CATEGORY” ⇒ “NATIONAL ACCOUNTS” ⇒ “NATIONAL INCOME & PRODUCT ACCOUNTS” ⇒ “GDP/GNP”, then find the data series labeled “Billions of Chained 2012 Dollars, Not Seasonally Adjusted”. – I think it’s easier to view this data in table form. To do that, click the link halfway down the page to “Table 1.1.6 Real Gross Domestic Product, Chained Dollars: Annual”. – Be sure you’ve selected “chained dollars” to get real GDP – Also be sure you’ve selected “annual” so you can see GDP for the whole year • For nominal GDP, click “CATEGORY” ⇒ “NATIONAL ACCOUNTS” ⇒ “NATIONAL INCOME & PRODUCT ACCOUNTS” ⇒ “GDP/GNP”, then find the data series labeled “Billions of Dollars, Annual, Not Seasonally Adjusted”. – Again, I think this data is easier to use in table form. To find that, click the link halfway down the page to “Table 1.1.5 Gross Domestic Product: Annual” – For nominal GDP, make sure you don’t see “real” or “chained” labels – Also be sure to select “annual” to find GDP for the whole year • To find population data, click “CATEGORY” ⇒ “POPULATION, EMPLOYMENT, & LABOR MARKETS” ⇒ “POPULATION”. The annual population should be toward the top of the list on that page. – Unfortunately this series doesn’t have a nice table linked at the bottom of the page. But you can click the “DOWNLOAD” button near the top of the page to see values for every year. 5 fill in the table below 2019 21372582 million 19032672 million Q21 Q24 Q27 Q30 Nominal GDP Real GDP Population Nominal GDP per capita Real GDP per capita Implied Deflator 1989 Q17 1956 Q18 Q19 Q20 Q22 Q25 Q28 Q31 Q23 Q26 Q29 Q32 *(FRED has updated their numbers for Nominal and Real GDP for 2019. I am following the same numbers as before) *Implied Deflator = Nominal GDP per capita × 100 Real GDP per capita 17 ⃝ (A) 5461580 million (B) 5641580 million (C) 5645180 million (D) 5156480 million (A) 443953 million (B) 445393 million (C) 449353 million (D) 449335 million (A) 9197997 million (B) 9179997 million (C) 9199779 million (D) 9791997 million 18 ⃝ 19 ⃝ 20 ⃝ 6 (A) 2939134 million (B) 2439193 million (C) 2933941 million (D) 2934391 million (A) 330513000 (B) 330351000 (C) 331305000 (D) 351330000 (A) 248773000 (B) 238747000 (C) 248773000 (D) 247387000 (A) 122168000 (B) 168221000 (C) 168212000 (D) 122681000 (A) 66446.88 (B) 68846.64 (C) 64664.88 (D) 64466.88 (A) 20428.67 (B) 22804.67 (C) 22467.80 (D) 20467.28 (A) 2671.21 (B) 2121.67 (C) 2621.71 (D) 2761.21 (A) 57558.24 (B) 57524.58 (C) 58524.75 (D) 57585.24 21 ⃝ 22 ⃝ 23 ⃝ 24 ⃝ 25 ⃝ 26 ⃝ 27 ⃝ 7 28 ⃝ (A) 37180.60 (B) 37160.80 (C) 38060.71 (D) 37060.18 (A) 17367.44 (B) 17467.43 (C) 17443.67 (D) 14367.74 (A) 121.29 (B) 112.29 (C) 112.92 (D) 121.92 (A) 64.33 (B) 63.33 (C) 61.33 (D) 62.33 (A) 15.13 (B) 15.31 (C) 13.15 (D) 11.53 29 ⃝ 30 ⃝ 31 ⃝ 32 ⃝ 8


